


Talking Points:
- US Dollar Eyes April Low After Brief Attempt at Bounce Fizzles
- S&P 500 Sinks to Monthly Low as Double Top Potential Builds
- Crude Oil Chart Setup Warns of Possible Topping Below $70.00
Can’t access the Dow Jones FXCM US Dollar Index? Try the USD basket on Mirror Trader. **
US DOLLAR TECHNICAL ANALYSIS – Prices are on pace to test April’s swing bottom anew after a second consecutive day of heavy losses. A daily close below the 38.2% Fibonacci expansion at 11737 exposes the 50% level at 11688. Alternatively, a reversal above the 23.6% level at 11799 opens the door for a challenge of the 14.6% Fib at 11837.
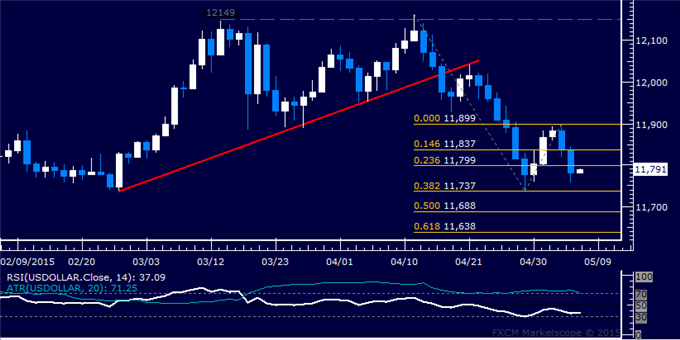
Daily Chart - Created Using FXCM Marketscope
** The Dow Jones FXCM US Dollar Index and the Mirror Trader USD basket are not the same product.
S&P 500 TECHNICAL ANALYSIS – Prices are edging lower as expected after putting in a Bearish Engulfing candlestick pattern, warning that a double top may be taking shape. A break below the 38.2% Fibonacci retracement at 2065.70 exposes the 50% level at 2047.10. Alternatively, a move back above the 23.6% Fib at 2088.70 targets the February 25 high at 2119.40.
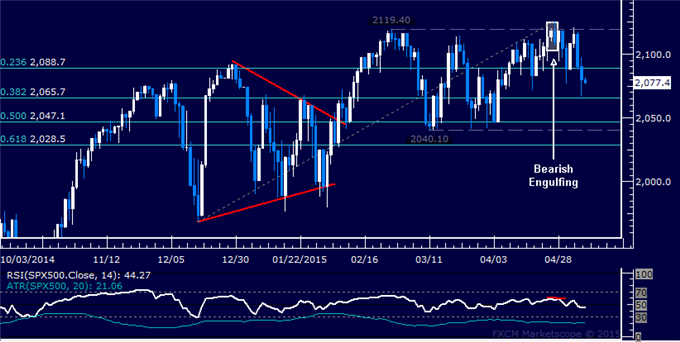
Daily Chart - Created Using FXCM Marketscope
GOLD TECHNICAL ANALYSIS – Prices continue to oscillate in a choppy range around the $1200/oz figure. A break below range support at 1178.09 exposes the 38.2% Fibonacci expansion at 1161.16. Range resistance remains at 1214.64.
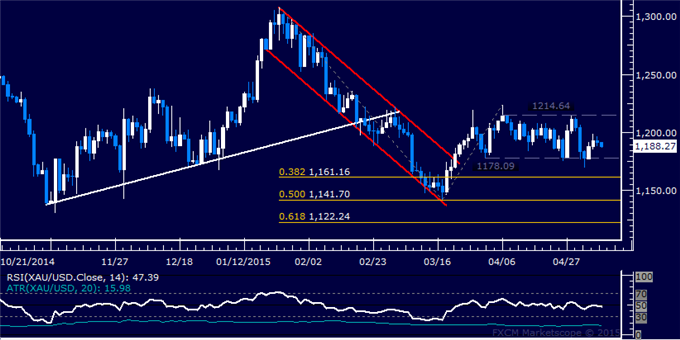
Daily Chart - Created Using FXCM Marketscope
CRUDE OIL TECHNICAL ANALYSIS – Prices put in a Shooting Star candlestick below resistance at 67.55, the 50% Fibonacci expansion, hinting at ebbing upside momentum and warning that a move downward may be ahead. A break below the 38.2% level at 66.09 exposes the 23.6% Fib at 64.29. Alternatively, a push above the 67.55 targets the 61.8% expansion at 69.01.

Daily Chart - Created Using FXCM Marketscope
--- Written by Ilya Spivak, Currency Strategist for DailyFX.com
To receive Ilya's analysis directly via email, please SIGN UP HERE
Contact and follow Ilya on Twitter: @IlyaSpivak


