


Talking Points:
- US Dollar Vulnerable as Bearish Reversal Clues Remain
- S&P 500 Trying to Clear Path to Retest December High
- Oil Digesting Gains Above $53, Gold Hits 1-Month Low
Can’t access the Dow Jones FXCM US Dollar Index? Try the USD basket on Mirror Trader. **
US DOLLAR TECHNICAL ANALYSIS – Prices continue to look vulnerable as a bearish Evening Star and negative RSI divergence warn of oncoming losses. A daily close below trend line support is at 11807 exposes the 14.6% Fibonacci retracement 11740. Alternatively, a push above the 11854-76 zone (14.6% Fib expansion, March 2009 high) opens the door for a challenge of the 23.6% threshold at 11963.
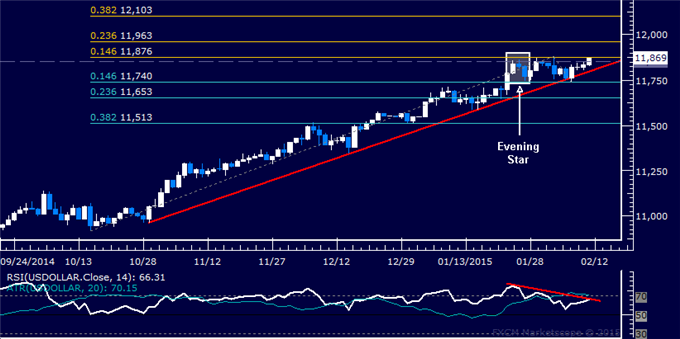
Daily Chart - Created Using FXCM Marketscope
** The Dow Jones FXCM US Dollar Index and the Mirror Trader USD basket are not the same product.
S&P 500 TECHNICAL ANALYSIS – Prices edged above resistance at 2068.60, the January 9 high, to challenge the 38.2% Fibonacci expansion at 2080.70. A break above that on a daily closing basis exposes the December 29 high at 2092.60, followed by the 50% level at 2112.90. Alternatively, a reversal back below 2068.60 targets the 23.6% Fib retracement at 2028.00.
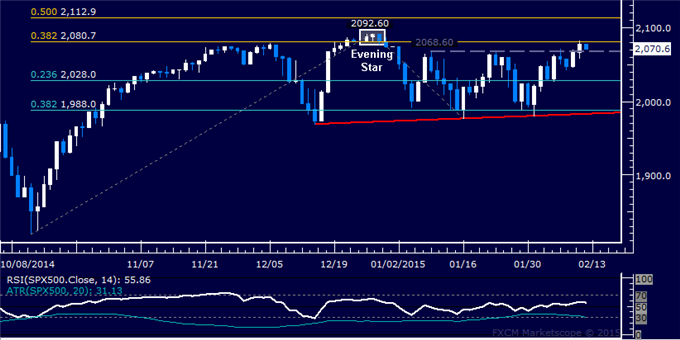
Daily Chart - Created Using FXCM Marketscope
GOLD TECHNICAL ANALYSIS – Prices are testing support at 1218.80, the 50% Fibonacci retracement, with a break below that on a daily closing basis exposing the intersection of rising trend line support and the 61.8% level at 1197.86. Alternatively, a reversal above the 38.2% Fib at 1239.73 aims for the October 21 high at 1255.20.
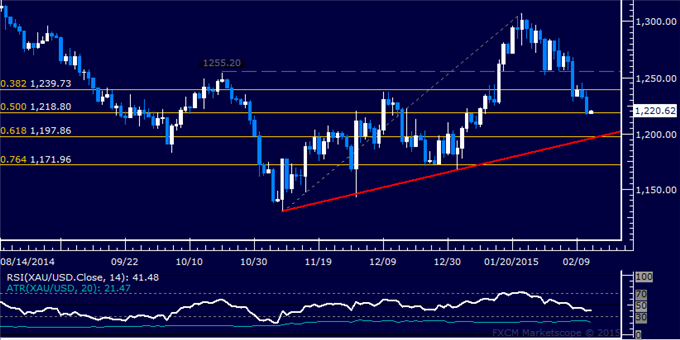
Daily Chart - Created Using FXCM Marketscope
CRUDE OIL TECHNICAL ANALYSIS – Prices are consolidating after pushing higher as expected following the appearance of a Morning Star candlestick pattern. A daily close above the 38.2% Fibonacci retracement at 59.08 exposes the 50% level at 63.38. Alternatively, a reversal below the 23.6% Fib at 53.77 targets the 14.6% retracement at 50.49.
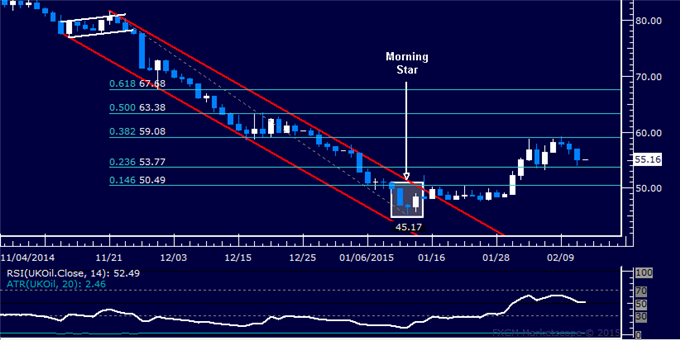
Daily Chart - Created Using FXCM Marketscope
--- Written by Ilya Spivak, Currency Strategist for DailyFX.com
To receive Ilya's analysis directly via email, please SIGN UP HERE
Contact and follow Ilya on Twitter: @IlyaSpivak


