


Talking Points:
- US Dollar Positioning Warns of Downside Reversal Risk
- S&P 500 Threatens Range Support Below 2000 Figure
- Crude Oil Trying to Make Good on Bullish Chart Setup
Can’t access the Dow Jones FXCM US Dollar Index? Try the USD basket on Mirror Trader. **
US DOLLAR TECHNICAL ANALYSIS – Prices may be readying to turn lower after producing a bearish Evening Star candlestick pattern. A daily close below the intersection of the 14.6% Fibonacci retracement and a rising trend line at 11734 exposes the 23.6% level at 11648. Alternatively, a reversal above the 11854-88 area marked by the March 2009 high and the 38.2% level opens the door for a challenge of the 50% Fib at 11983.
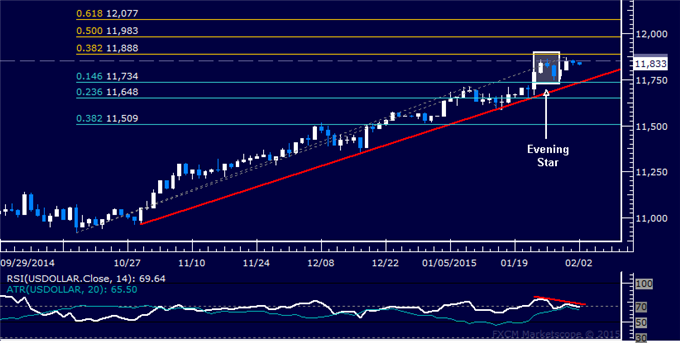
Daily Chart - Created Using FXCM Marketscope
** The Dow Jones FXCM US Dollar Index and the Mirror Trader USD basket are not the same product.
S&P 500 TECHNICAL ANALYSIS – Prices declined as expected after putting in a bearish Evening Star candlestick pattern. A daily close below the 38.2% Fibonacci retracement at 1988.00 exposes the 50% level at 1955.80. Alternatively, a rebound above trend line support-turned-resistance at 1999.10 targets the 23.6% Fib at 2028.00.
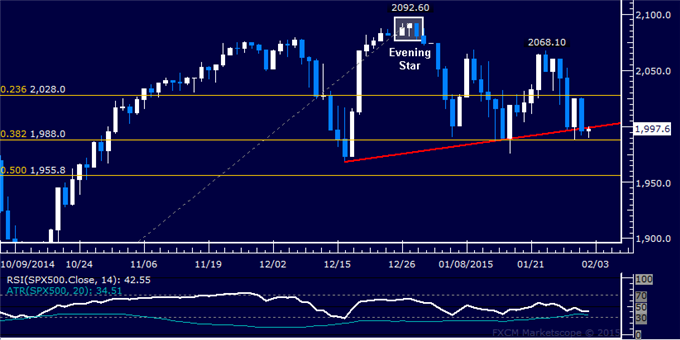
Daily Chart - Created Using FXCM Marketscope
GOLD TECHNICAL ANALYSIS – Prices recoiled from resistance-turned-support at October’s swing highs, producing the largest daily advance in 3 weeks. A daily close above the 23.6% Fibonacci expansion at 1285.20 exposes the 38.2% level at 1305.73. Alternatively, a reversal below the 38.2% Fib retracement at 1253.77 targets the 50% threshold at 1237.18.
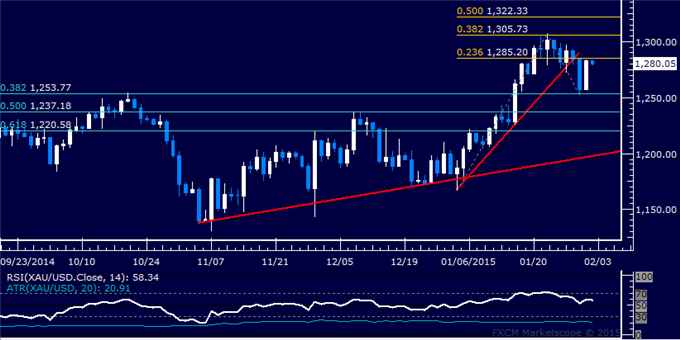
Daily Chart - Created Using FXCM Marketscope
CRUDE OIL TECHNICAL ANALYSIS – Prices pushed higher following a prolonged period of consolidation after bottoming as expected above the $45.00/barrel figure. A daily close above the 23.6% Fibonacci retracement at 53.77 exposes the 38.2% level at 59.08. Alternatively, a reversal below the 14.6% Fib at 50.49 targets the 14.6% Fib expansion at 47.07.
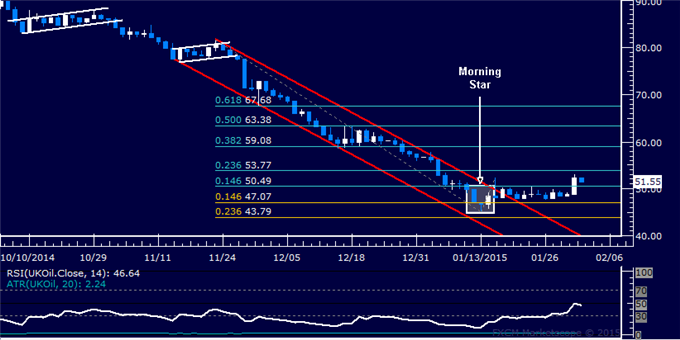
Daily Chart - Created Using FXCM Marketscope
--- Written by Ilya Spivak, Currency Strategist for DailyFX.com
To receive Ilya's analysis directly via email, please SIGN UP HERE
Contact and follow Ilya on Twitter: @IlyaSpivak


