


Talking Points:
- US Dollar Chart Setup Points to Topping at Six-Year High
- SPX 500 May Be Readying to Resume Selloff After Rebound
- Crude Oil Targets $46.00, Gold En Route to December Top
Can’t access the Dow Jones FXCM US Dollar Index? Try the USD basket on Mirror Trader. **
US DOLLAR TECHNICAL ANALYSIS – Prices look likely to continue downward following the appearance of a bearish Evening Star candle pattern having reversed as expected. A daily close below the 14.6% Fibonacci retracementat 11599 exposes the 23.6% level at 11527. Alternatively, a reversal above the 23.6% Fib expansion at 11699 opens the door for a challenge of the 38.2% threshold at 11796.
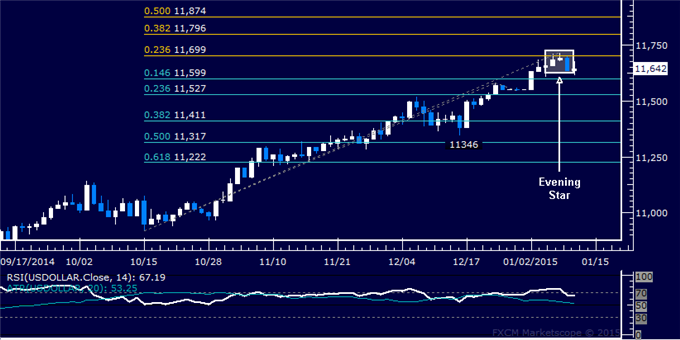
Daily Chart - Created Using FXCM Marketscope
** The Dow Jones FXCM US Dollar Index and the Mirror Trader USD basket are not the same product.
S&P 500 TECHNICAL ANALYSIS – Prices declined as expected after putting in a bearish Evening Star candlestick pattern. A secondary top may now be in place as a corrective bounce is capped by a Dark Cloud Cover candle setup. Near-term support is at 2028, the 23.6% Fibonacci retracement, with a break below that exposing the 38.2% level at 1988.00. Alternatively, a turn above the January 9 high at 2068.60 targets the December 29 top at 2092.60.
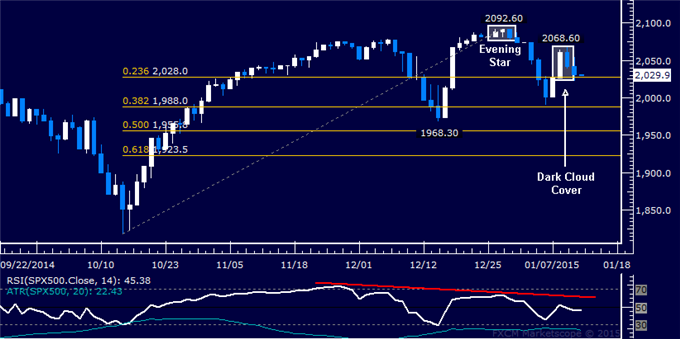
Daily Chart - Created Using FXCM Marketscope
GOLD TECHNICAL ANALYSIS – Prices continue to press upward, with December’s swing top now in the crosshairs. A break above the 61.8% Fibonacci expansion at 1233.62 exposes the 76.4% level at 1249.39. Alternatively, a reversal below the 50% Fib at 1220.88 aims for the 38.2% expansion at 1208.13.
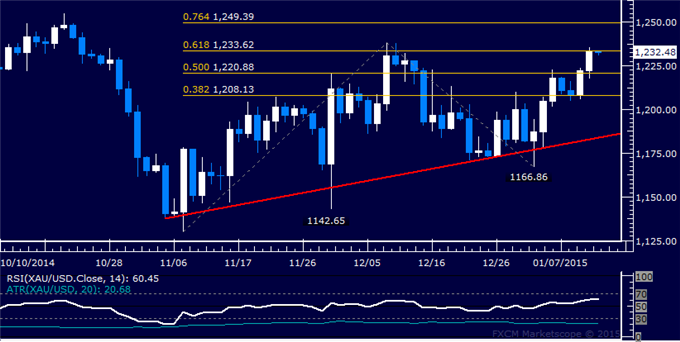
Daily Chart - Created Using FXCM Marketscope
CRUDE OIL TECHNICAL ANALYSIS – Prices accelerated downward, with sellers now aiming to challenge the 76.4% Fibonacci expansion at 46.00. A break below that on a daily closing basis exposes the 100% level at 40.55. Alternatively, a turn above the 61.8% Fib at 49.37 targets the 50% expansion at 52.10.
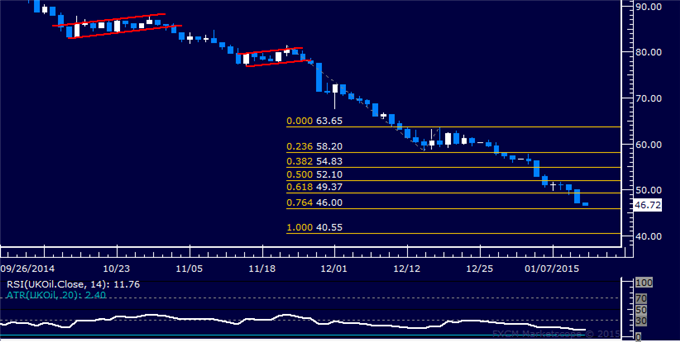
Daily Chart - Created Using FXCM Marketscope
--- Written by Ilya Spivak, Currency Strategist for DailyFX.com
To receive Ilya's analysis directly via email, please SIGN UP HERE
Contact and follow Ilya on Twitter: @IlyaSpivak


