


CoT Highlights:
- Large specs remain about as pessimistic as any time in nearly two decades
- GBP speculative shorts shrinking as price declines (unusual behavior)
- Large speculator profiles for other major currencies/markets
See the IG Client Sentiment page for a timelier look at sentiment in major currencies and markets.
On Friday, there weren’t any wild one week changes to speak of, but there is one curious trend which has emerged in the British Pound as large speculators continue to cover into price weakness. Gold traders haven’t made any significant moves in the past few weeks, but with their positioning representing the most pessimistic since the early 2000s, one has to wonder if they have capitulated or could we see selling continue along with a decline in the price of gold as was the case in the mid to late-90s?
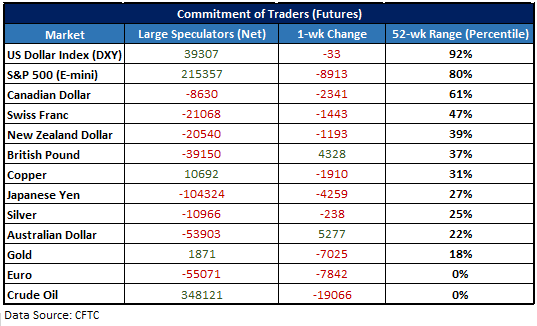
On Fridays the CFTC releases a detailed report of traders’ positioning in the futures market as reported for the week ending on Tuesday. Outlined in the table below are key stats concerning the positioning of large speculators (i.e. hedge funds, CTAs, etc.), excluding small speculators and commercial traders.
‘Large specs’ are known to typically employ trend-following strategies, and as such, they tend to add to long positions and reduce shorts in uptrends while reducing long positions and increasing shorts in downtrends. When analyzing the data, we take into consideration the direction of their position, magnitude of changes, as well as extremes.
Key stats: Net position, one-week change, and where the current position stands relative to the past 52 weeks.
See what fundamental and technical drivers are at work in the Q4 Trading Forecasts.
Large specs remain about as pessimistic as any time in nearly two decades
Large speculators are currently net-long just under 2k contracts of gold, which of course at first glance isn’t an extreme. They were even a little short as recently as October and have been generally flat since August. Not an extreme, but it does represent about as bearish of a position as this group of traders has held since prior to the 2001-2011 bull market.
After having held a net-long from the 2011 peak (and often-times a very large position), has the giving up on bullish exposure meant we’ve seen a capitulation or could we see a net-short grow in the months ahead as price declines further?
The answer to this question might lie in the price action. While large speculators have essentially given up on a rally, we haven’t seen the type of price behavior which suggests capitulation has taken shape. Back around 1996 large speculators became generally short and it proved to be the correct bet as gold declined by about 40% until a low in 1999.
This may not be how things play out this time around, but so far long-term price action is generally uninspiring and it seems we could see a decline below the 2015 low at 1045 before a sustainable long-term low is forged. If a bearish theme continues to grow legs then look for large speculators to finally get on the right side of the decline over the past several years.
Gold Positioning Chart

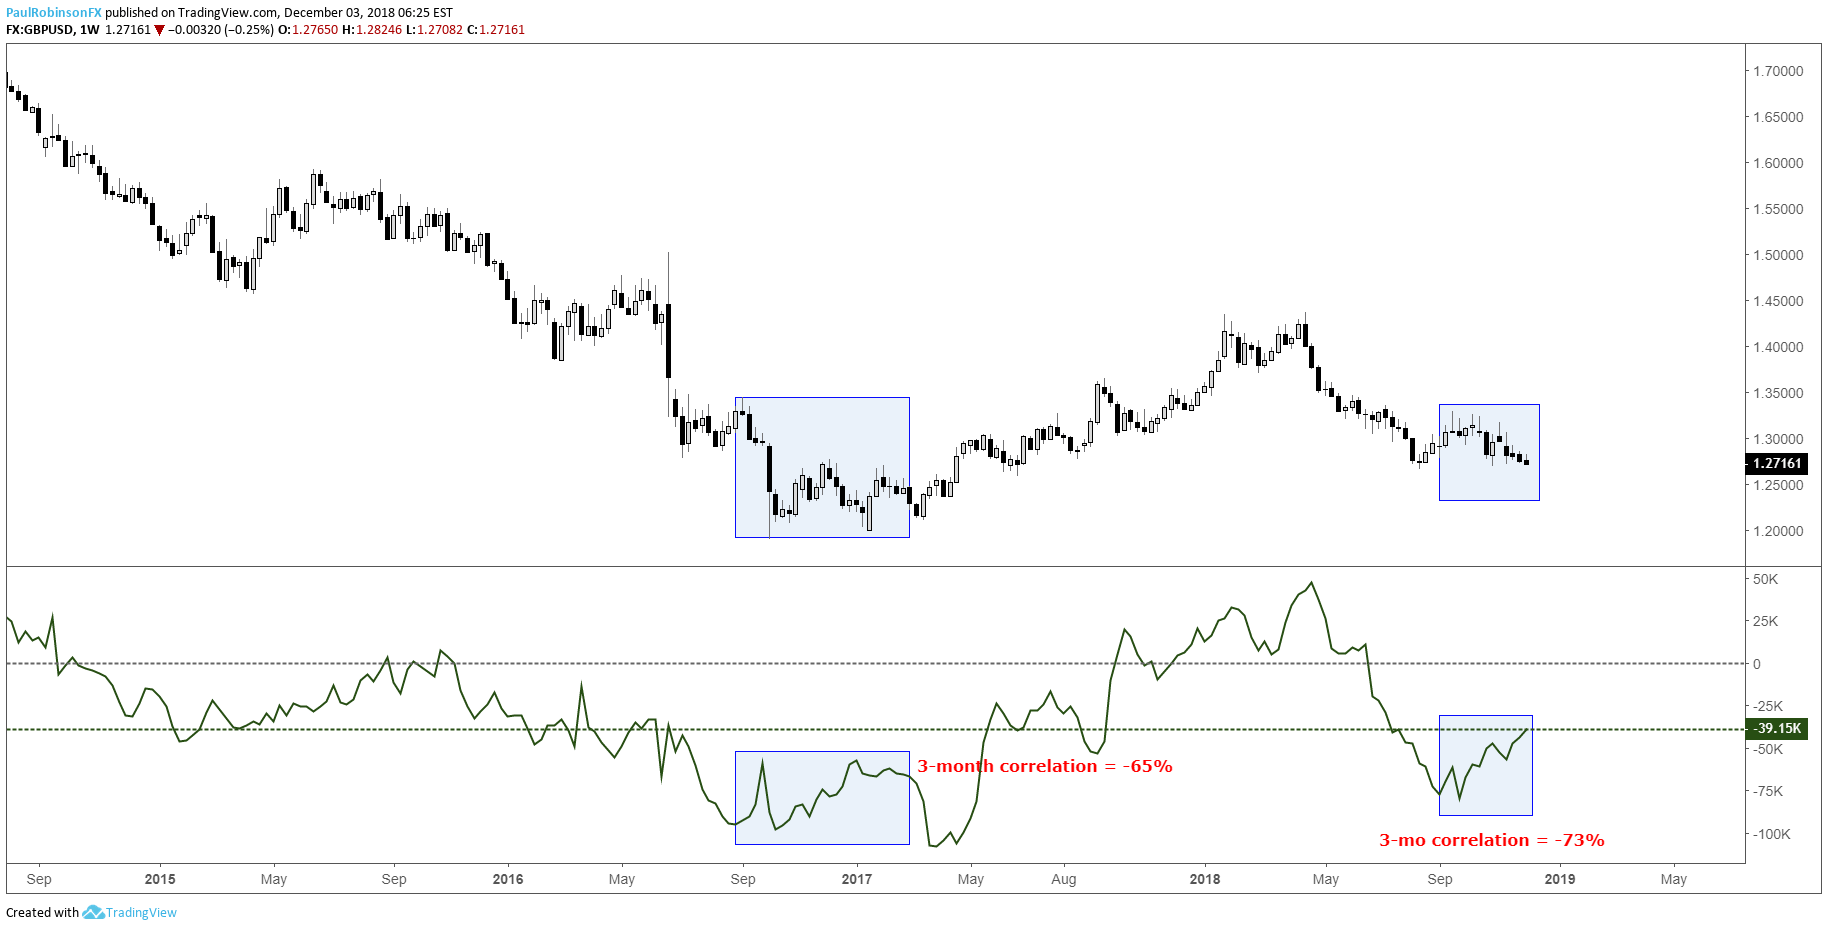
GBP speculative shorts shrinking as price declines (unusual behavior)
Last week, large specs reduced their net-short for the 7th time out of the past 10 weeks. Large speculators are generally considered trend-followers and so to see short-covering into weakness is counter to their typical behavior, and may turn out to be an important intermediate-term occurrence.
Over the past decade the correlation between the price of GBP and changes in net-positioning in the futures market is +63%, however; the 3-mo correlation is currently -73%, the most extreme negative correlation over at least the past decade.
This could be telling us something is up, and that could be the price of GBP if this turns out to be similar to the last time large specs pivoted from selling to covering into a down-move. Back in late 2016, early 2017 large specs spent some time covering while GBPUSD remained weak.
At that time the 3-month correlation of GBP price to positioning was the 2nd most negative in at least a decade at -65%. While the situation wasn’t perfect, in that we then saw a big addition to shorts just as Cable was coming out of the low, the short-covering into weakness nevertheless proved to be an early sign that a material move higher was coming.
Perhaps this time around short-covering proves to be incorrect and in a shuffle to get on the right side of the decline they rush in to sell helping drive prices down at a rapid rate. In either event, it's the unusual behavior which has my interest piqued, and it looks like GBPUSD is headed for a sizable move soon.
The technical backdrop is weak and suggests more weakness, but if we see some type of sustained pop higher (whether from near current levels or after more selling), then that could quickly change. Keep in mind, this could take several weeks or longer before we have a clearer picture, CoT data is to be used for intermediate to long-term outlooks.
British Pound Positioning Chart
Other markets:
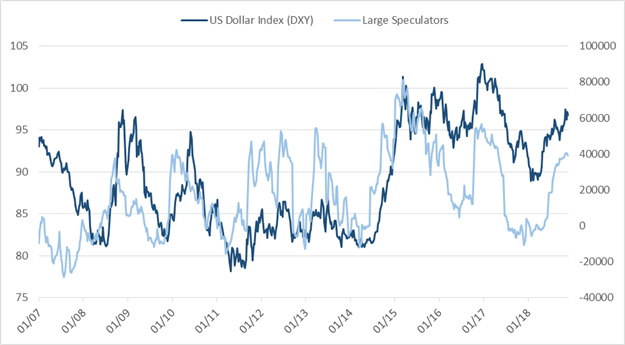
US Dollar Index (DXY)
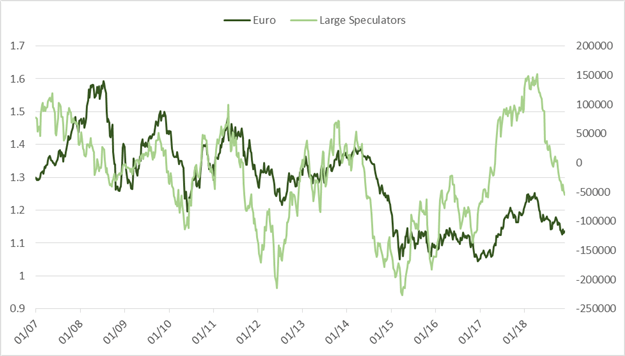
Euro
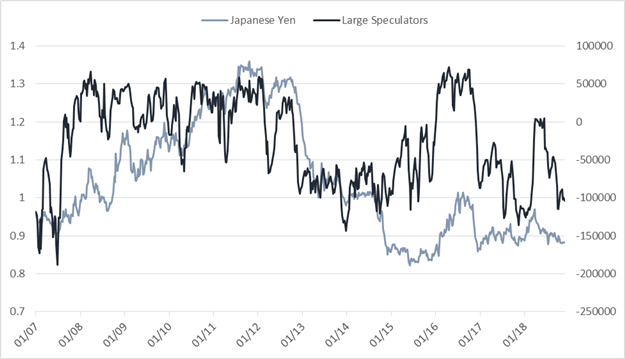
Japanese Yen
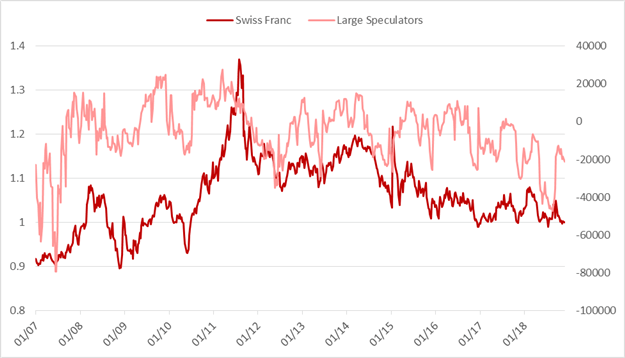
Swiss Franc
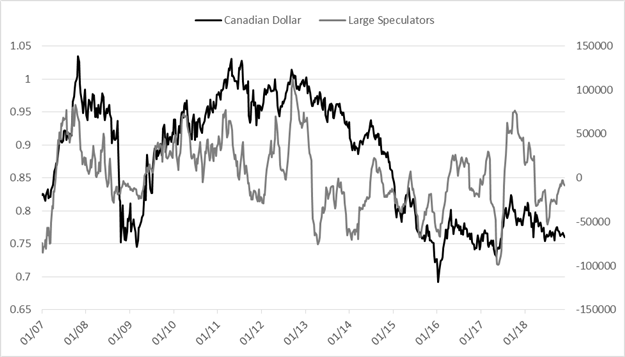
Canadian Dollar
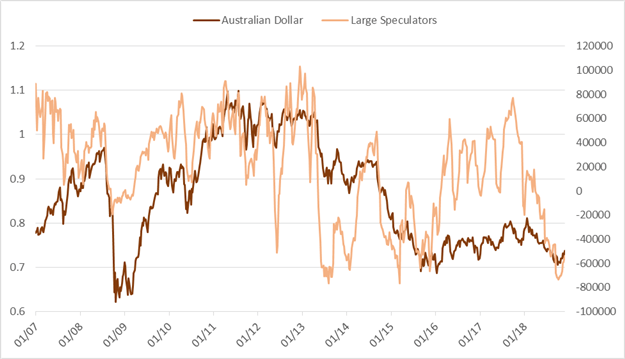
Australian Dollar
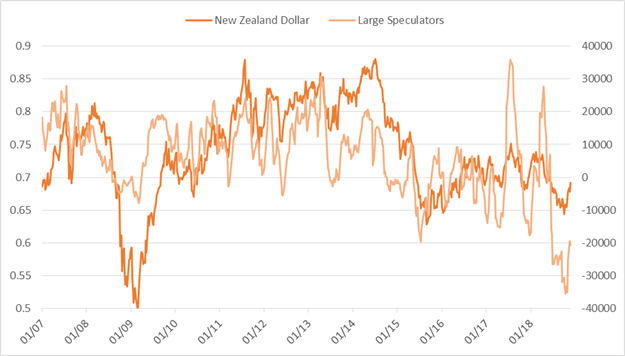
New Zealand Dollar
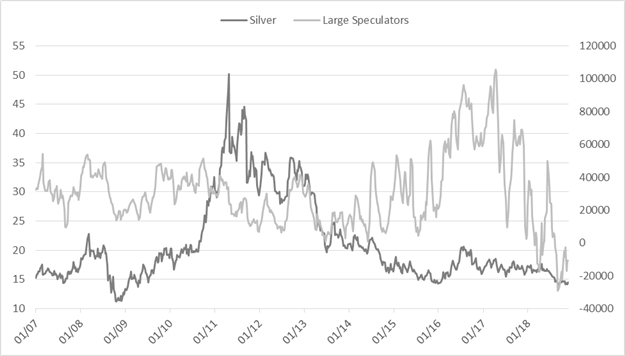
Silver
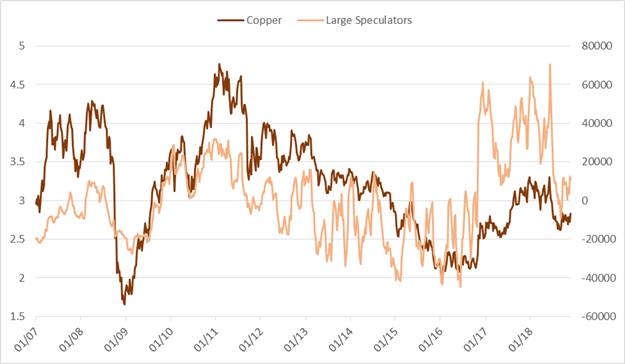
Copper
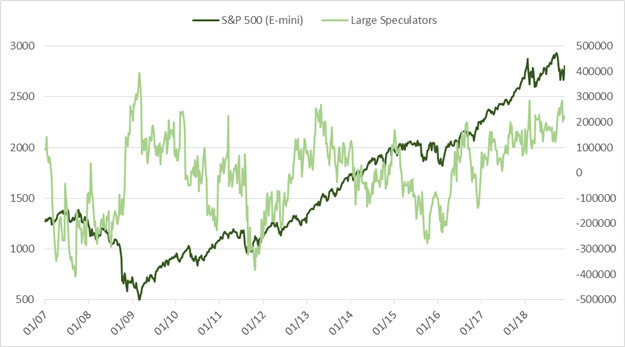
S&P 500 (E-mini)
Resources for Forex & CFD Traders
Whether you are a new or experienced trader, we have several resources available to help you; indicator for tracking trader sentiment, quarterly trading forecasts, analytical and educational webinars held daily, trading guides to help you improve trading performance, and one specifically for those who are new to forex.
---Written by Paul Robinson, Market Analyst
You can follow Paul on Twitter at @PaulRobinsonFX


