


CoT Highlights:
- Large specs seen as likely to keep reducing long exposure in oil
- Charts unfavorable in short to intermediate-term
- Large spec profiles for major FX and markets
For a timelier look at sentiment in major currencies and markets, see the IG Client Sentiment page.
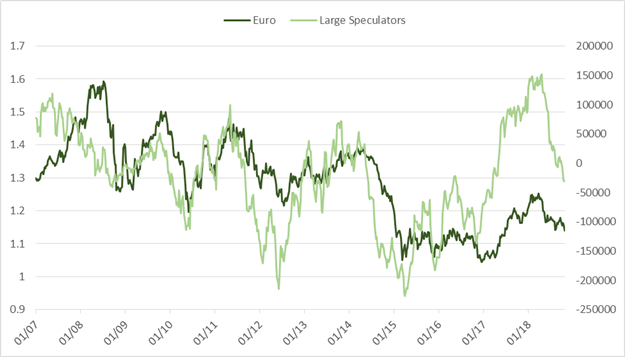
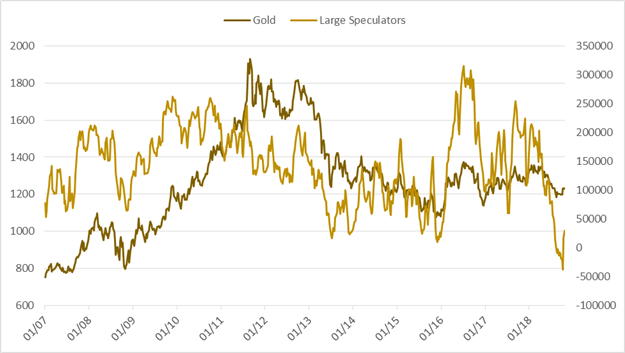
The most recent report showed oil bulls reducing their long exposure further as the commodity continues to pull off long-term resistance. A trend seen as likely to continue. Large specs are the shortest the Euro they have been since March of last year, while in the Pound they have been reducing short exposure the past month despite price remaining relatively unchanged. After a record surge in buying last week, large specs added a few more gold contracts to their books.
On Fridays the CFTC releases a detailed report of traders’ positioning in the futures market as reported for the week ending on Tuesday. Outlined in the table below are key stats concerning the positioning of large speculators (i.e. hedge funds, CTAs, etc.), excluding small speculators and commercial traders.
‘Large specs’ are known to typically employ trend-following strategies, and as such, they tend to add to long positions and reduce shorts in uptrends while reducing long positions and increasing shorts in downtrends. When analyzing the data, we take into consideration the direction of their position, magnitude of changes, as well as extremes.
Key stats: Net position, one-week change, and where the current position stands relative to the past 52 weeks.

Large specs seen as likely to keep reducing long exposure in oil
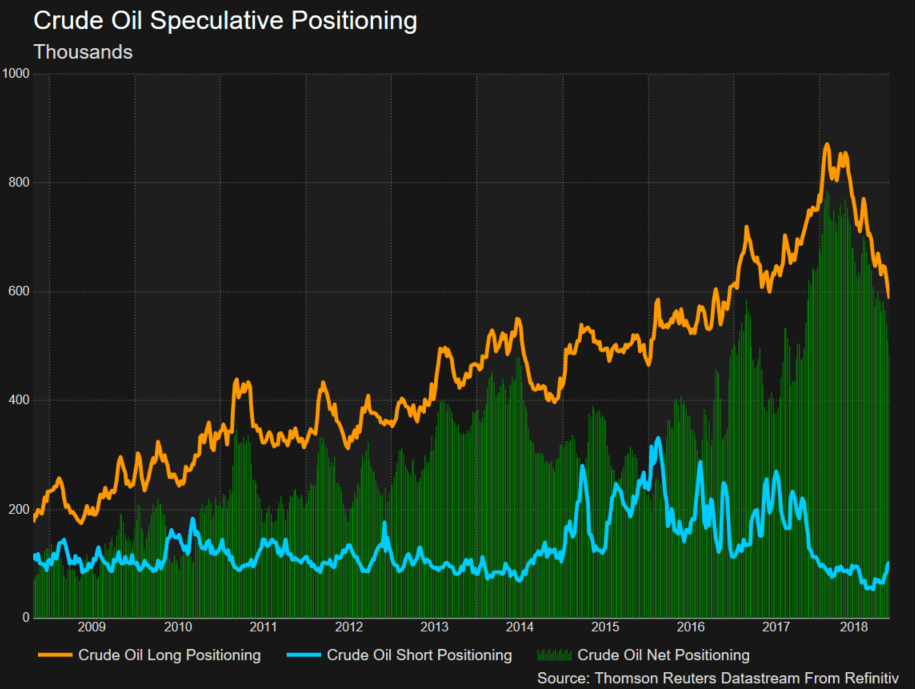
Last week, we saw a further reduction in large speculative longs as the price of oil weakened further. This is the 9th time in the last 13 weeks we’ve seen long exposure decline, taking the current net position to +455k contracts, the smallest in a year.
While the price of WTI topped only recently, positioning has been steadily declining since hitting a record high of +739k back in February. The net long is anticipated to continue to shrink with the macro-technical picture having turned negative, as the most recent decline appears to be the beginning of a larger trend reversal.
Crude Oil Positioning Chart (Big reduction in longs)
Charts unfavorable in short to intermediate-term
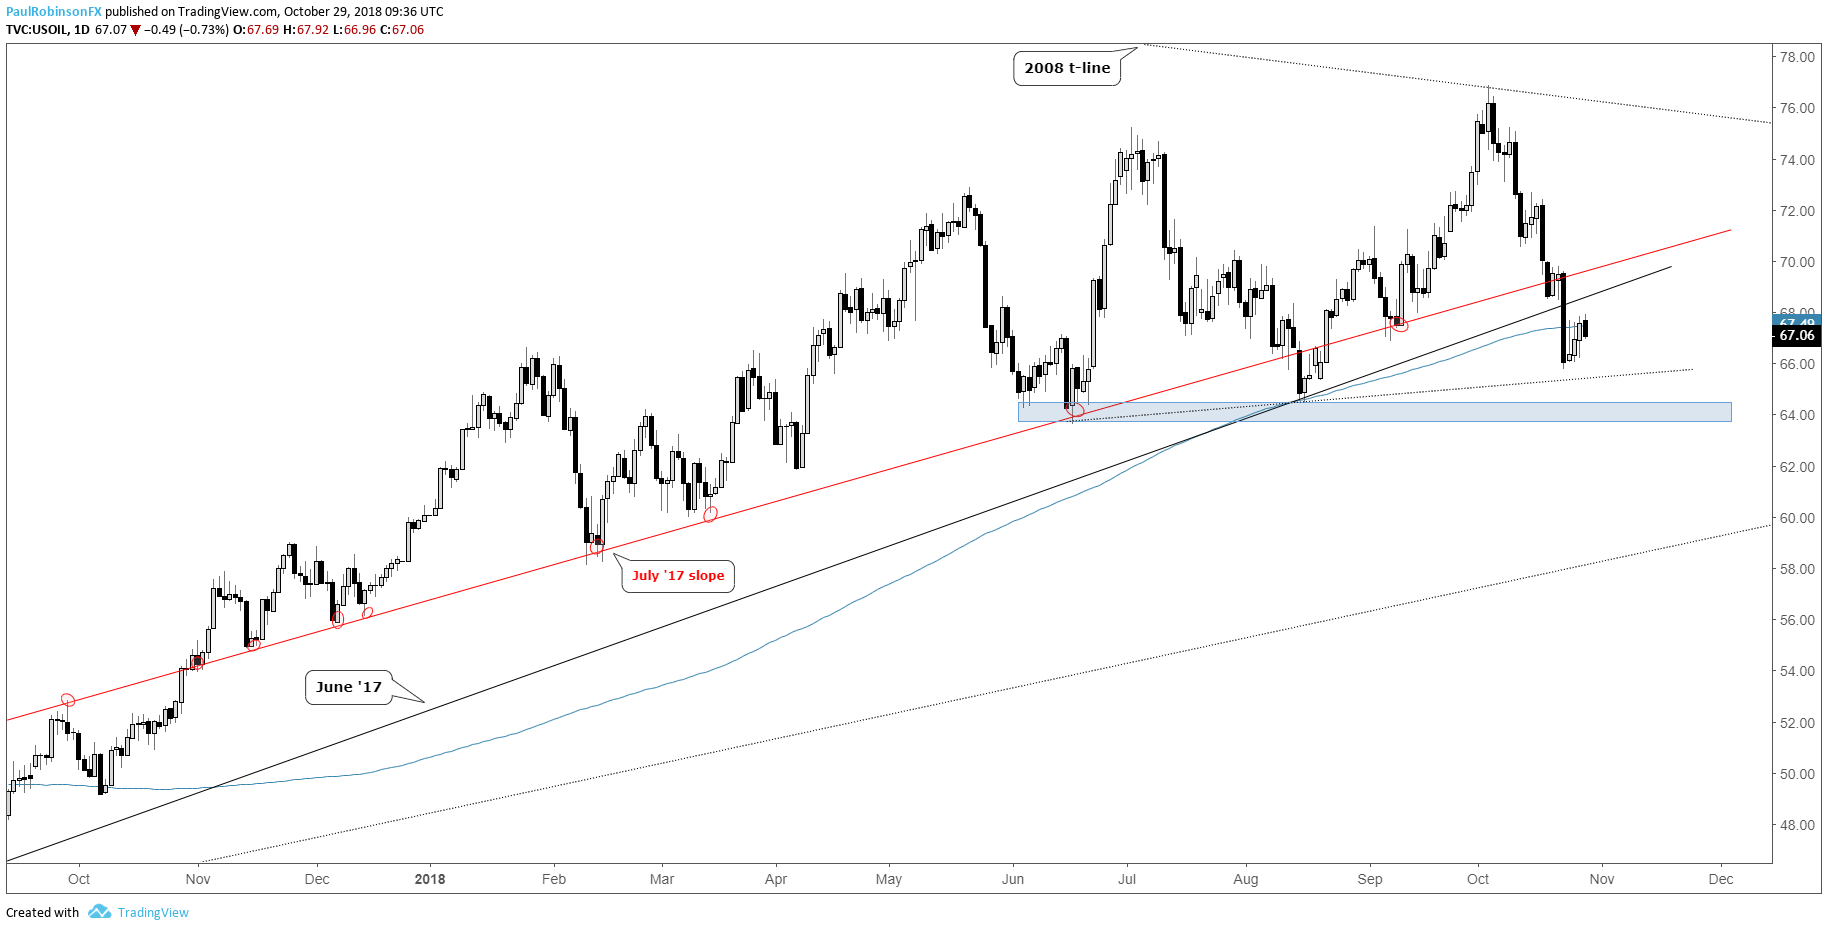
The 2008 trend-line and lows from 2011 and 2012 were in focus recently, and the strong decline off these important long-term thresholds has brought to light the potential for a larger decline in the weeks and months ahead.
Trend support running up from the 2016 low is targeted in the vicinity of 59/60 before we see a big uptrend test take shape. Down there you also have a slope extending higher from all the way back to 1998.
In the short-term, more weakness is expected with the July slope and June trend-line from last year, along with the 200-day MA having been broken. Below is a minor trend-line from June, and then the lows from June and August in the area of 64.50/63.60. Watch how price action plays out on a touch of these levels to determine whether a corrective bounce wants to develop first before going lower over the intermediate-term.
Crude Oil Weekly Chart (Turned down off long-term resistance)

Crude Oil Daily Chart (Watch support)
See what fundamental and technical drivers are at work in the Q4 Trading Forecasts.
Large speculator profiles for major FX & markets:
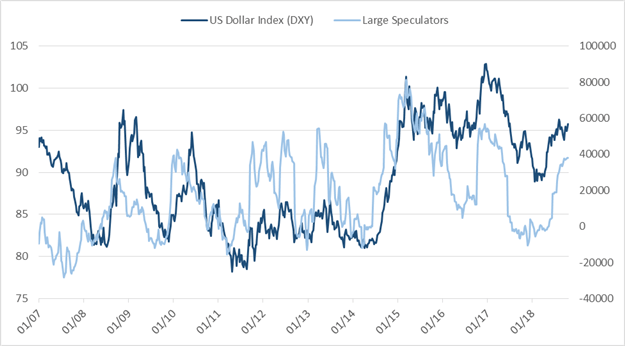
US Dollar Index (DXY)
Euro
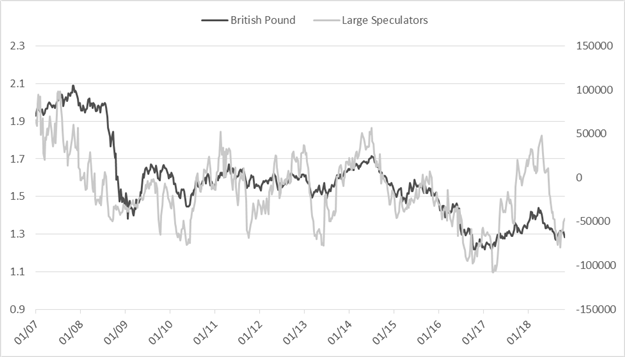
British Pound
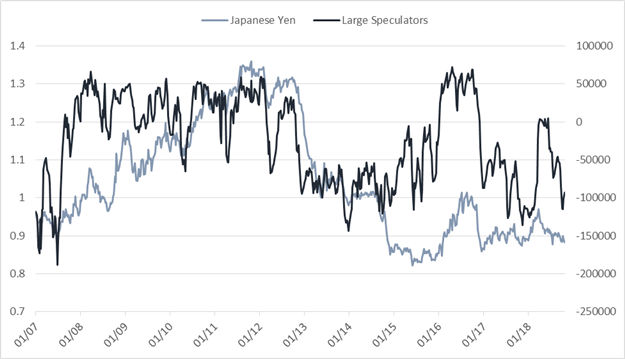
Japanese Yen
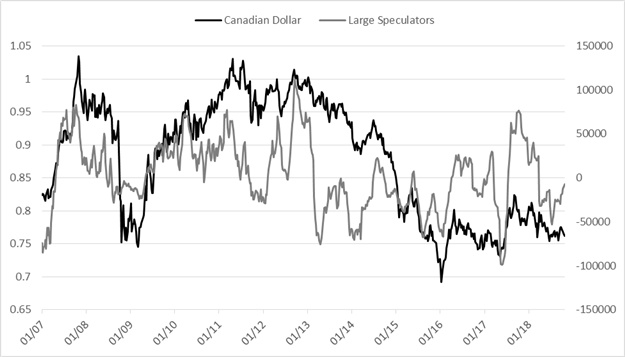
Canadian Dollar
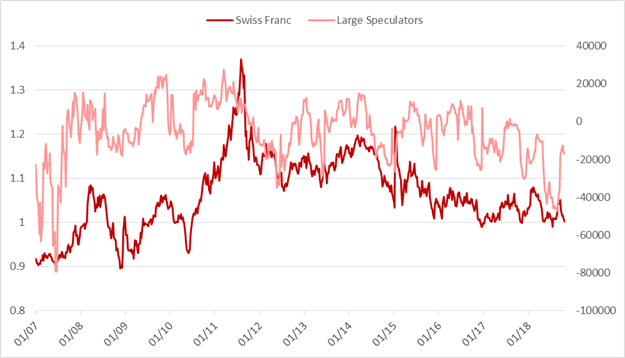
Swiss Franc
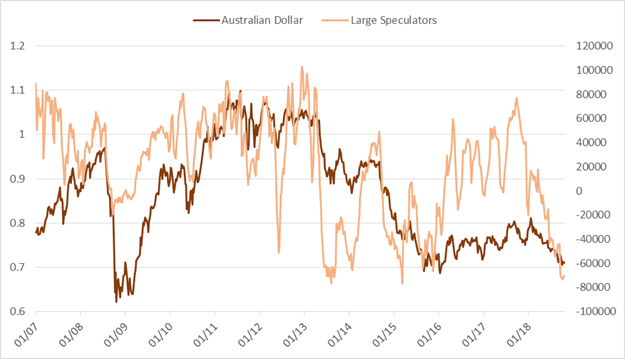
Australian Dollar
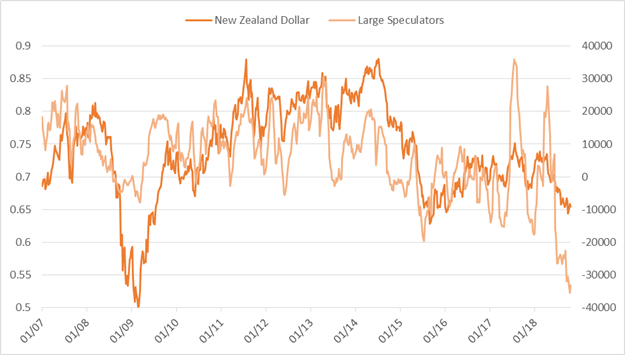
New Zealand Dollar
Gold
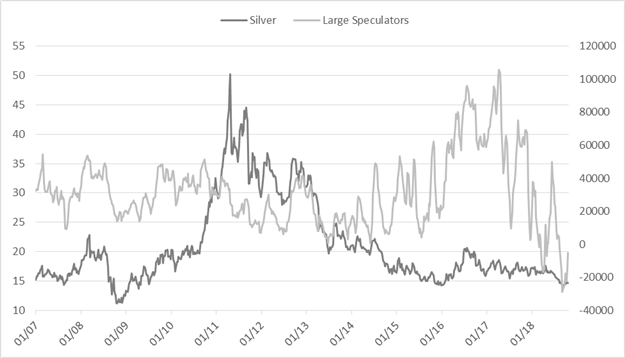
Silver
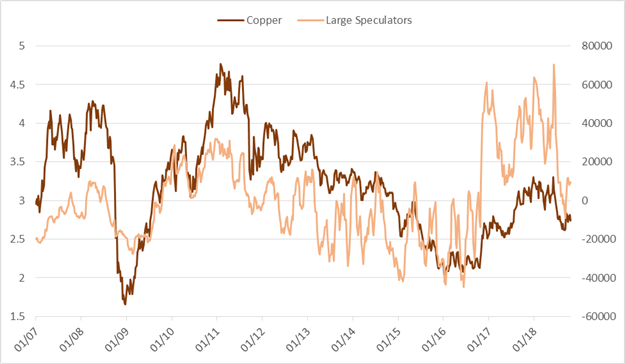
Copper
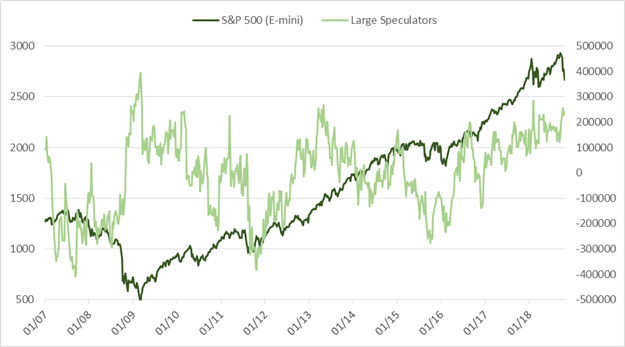
S&P 500 (E-mini)
Resources for Forex & CFD Traders
Whether you are a new or experienced trader, we have several resources available to help you; indicator for tracking trader sentiment, quarterly trading forecasts, analytical and educational webinars held daily, trading guides to help you improve trading performance, and one specifically for those who are new to forex.
---Written by Paul Robinson, Market Analyst
You can follow Paul on Twitter at @PaulRobinsonFX


