


CoT Highlights:
- Large speculators longest since the end of the plunge of the last bear market
- Buying the dip to the tune of 113k contracts in one week in S&P 500 (E-mini) contracts
- Futures positioning charts for other key FX-pairs and markets
The CoT report is longer-term sentiment indicator; for short-term sentiment indications see the IG Client Sentiment page.
The most recent Commitment of Traders (CoT) report showed a few notable changes, but maybe none more interesting than the positioning change in the S&P 500. We’ll take a look at what this might mean in the short to longer-term.
Every Friday, the CFTC releases the weekly report showing traders’ positioning in the futures market as reported for the week ending on Tuesday. In the table below, we’ve outlined key statistics regarding net positioning of large speculators (i.e. hedge funds, CTAs, etc.). This group of traders are largely known to be trend-followers due to the strategies they typically employ, collectively. The direction of their position, magnitude of changes, as well as extremes are taken into consideration when analyzing how their activity could impact future price fluctuations.
Key stats: Net position, one-week change, and where the current position stands relative to the past 52 weeks.

Large speculators ‘buy-the-dip’ in the S&P 500
The plunge off the highs has clearly attracted an already long crowd of trend-followers, as the most report showed a spike in buying to the tune of over 113k contracts. This brings the total net-long held by large speculators to 286k contracts, the largest since March 2009 when the stock market put in a major bear market bottom.
Obviously, the context is much different than it was back at the tail end of one of the worst bear markets on record. With that said, in the short-term the market looks oversold, and if Friday’s sharp reversal in the S&P 500 from the 200-day MA can hold, then a sizable bounce is anticipated.
However, looking out longer-term, the decline may have been the ‘shot across the bow’; a warning sign of growing instability in what has been a spectacular run over the years. Even if we see new record highs in the not-too-distant future it may only prove temporary as the process of a market top may have begun. It’s too soon to say, but if so, then the recent speculative purchases could prove to only be profitable in the short to intermediate-term.
Chart 1 – S&P 500 (E-mini) Positioning
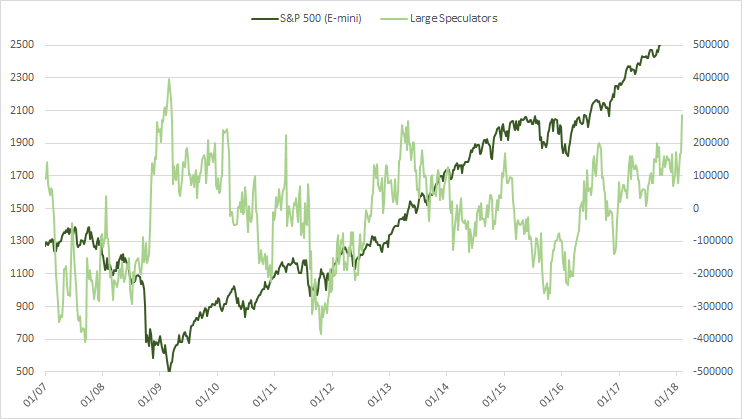
Chart 2 – S&P 500 Cash Index: Daily
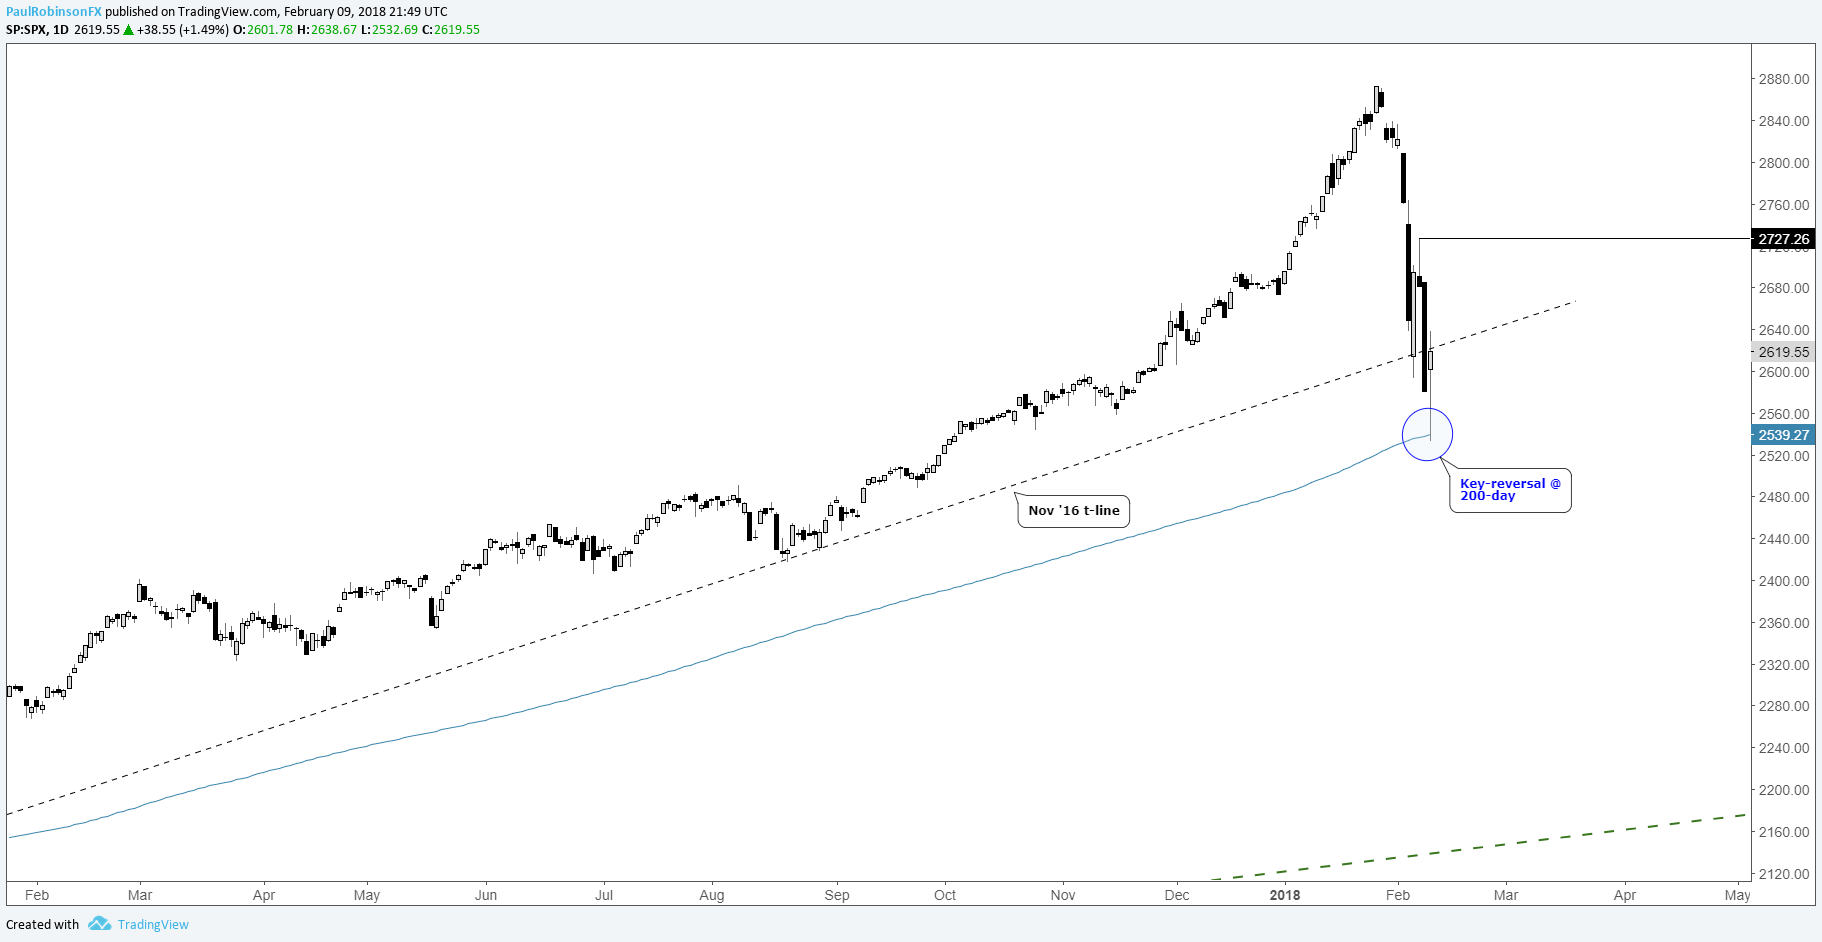
Chart 3 – S&P 500 Cash Index: Monthly
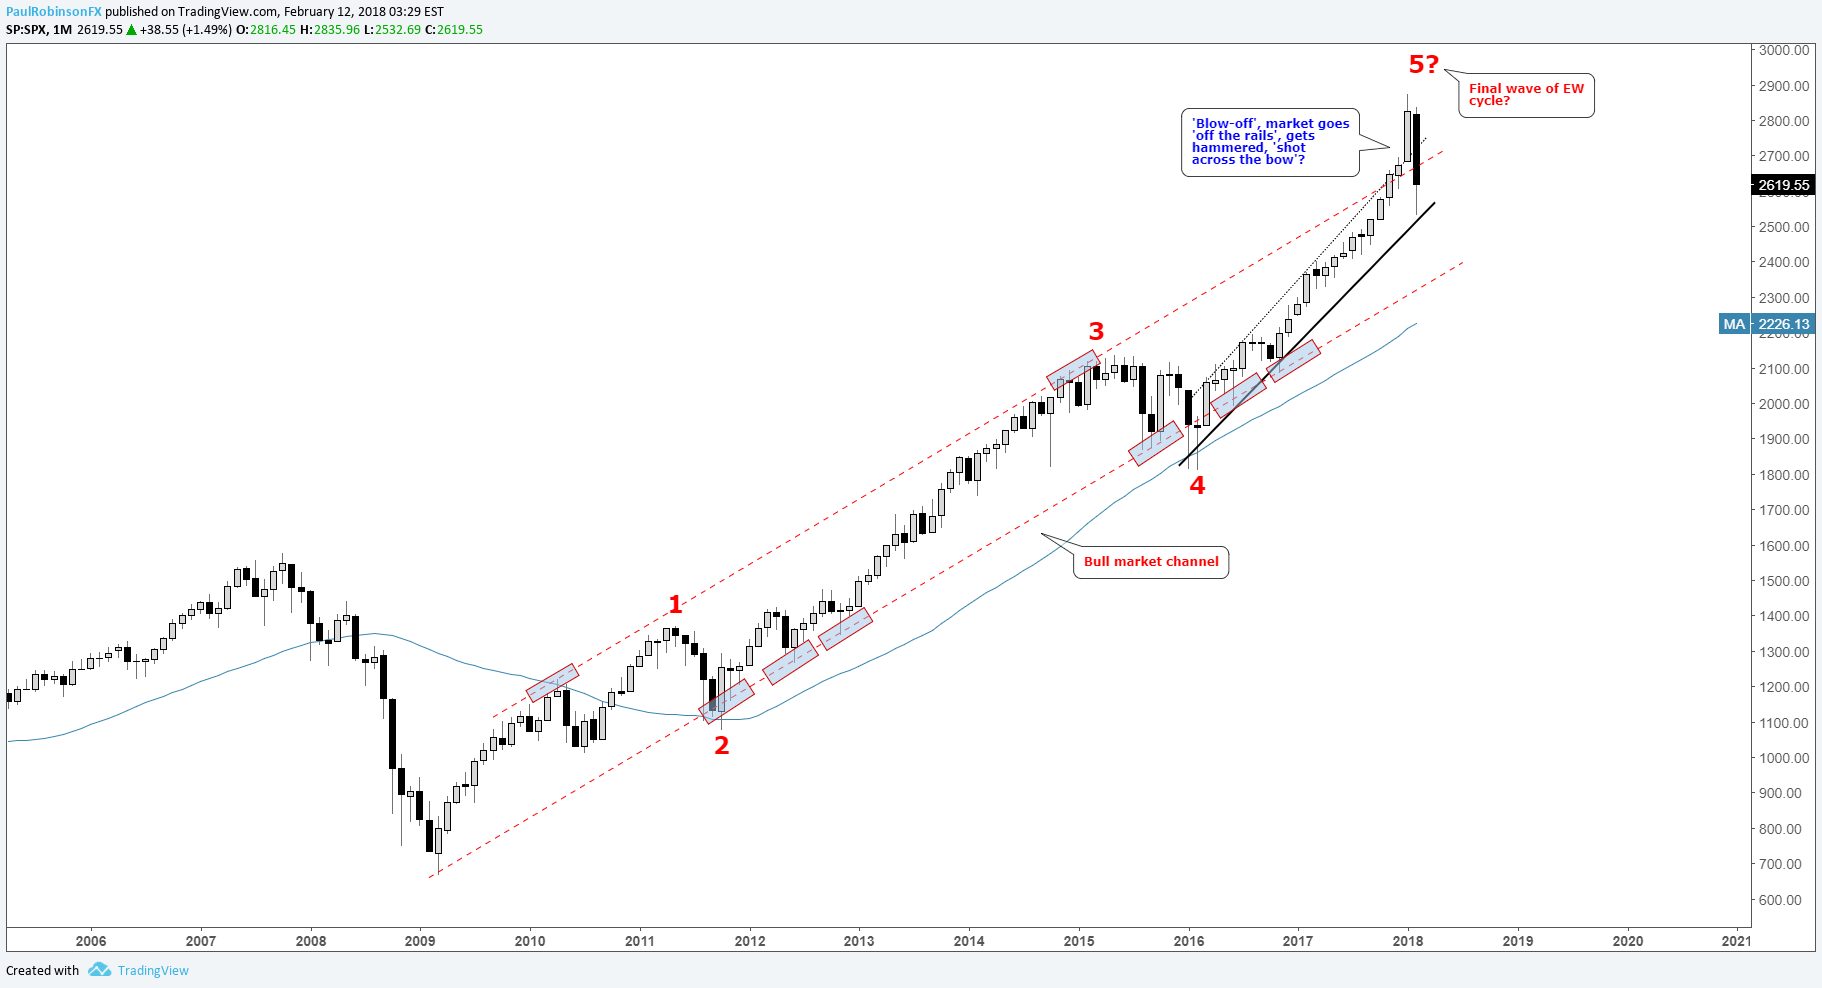
Market blows through top of bull market channel during what appears to be the 5th wave of an Elliot-wave cycle off the 2009 low. Could the recent tank be the first sign of a market about to undergo the topping process? (This could still involve a new high as part of the process...)
To see how sentiment could tie into our outlook on FX pairs and markets, check out the DailyFX Q1 Forecasts.
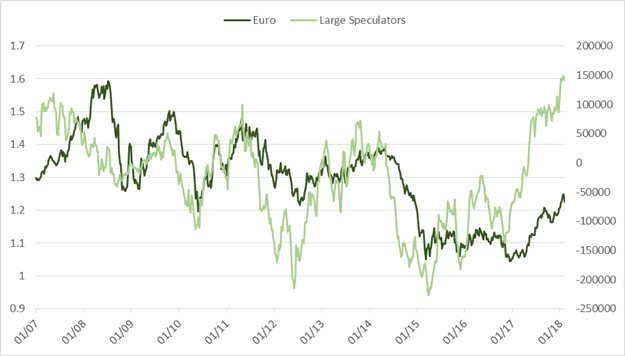
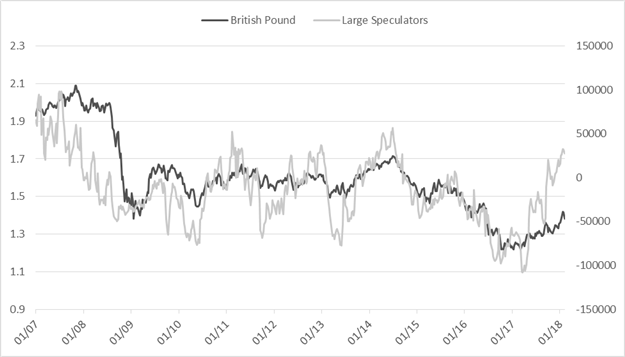
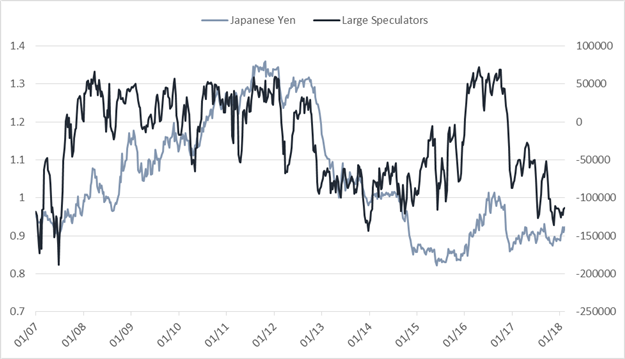
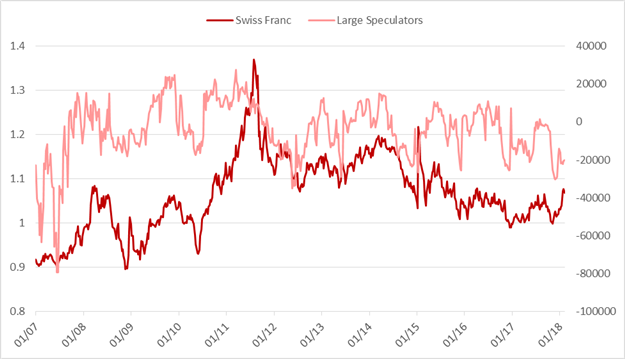
Large speculator profiles:
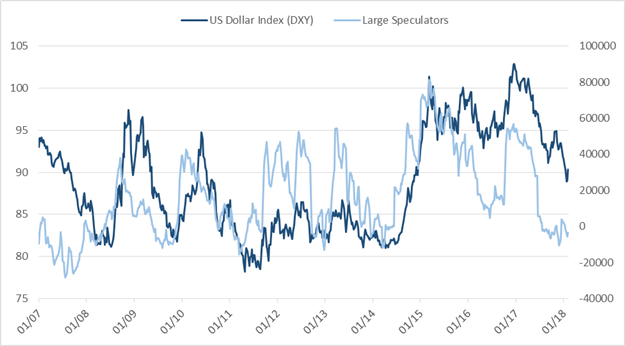
US Dollar Index (DXY)
Euro
British Pound
Japanese Yen
Swiss Franc
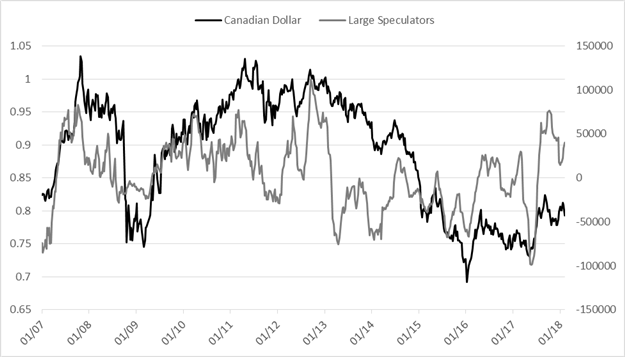
Canadian Dollar
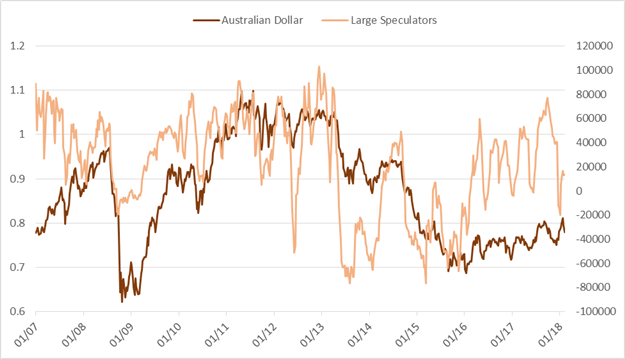
Australian Dollar
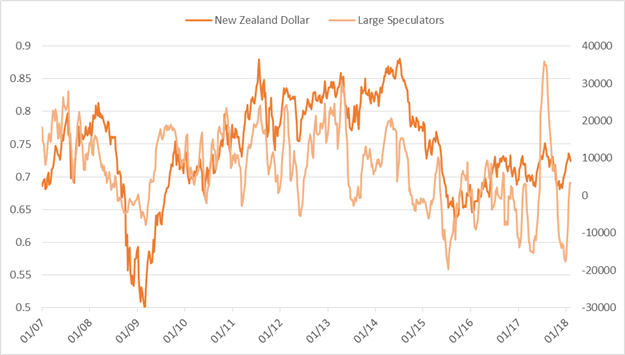
New Zealand Dollar
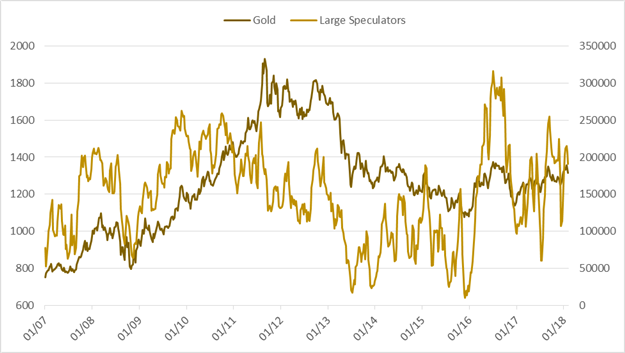
Gold
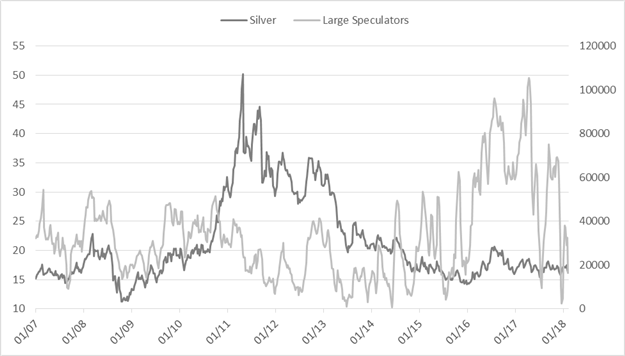
Silver
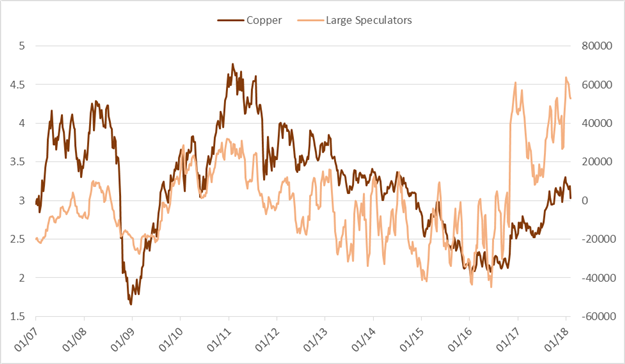
Copper
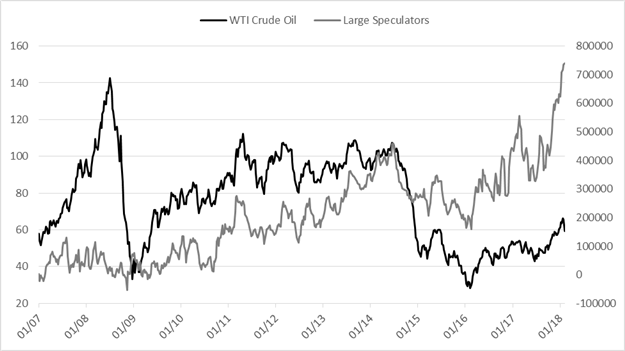
Crude Oil
Trader Resources
Whether you are a new or experienced trader, we have several resources available to help you; indicator for tracking trader sentiment, quarterly trading forecasts, analytical and educational webinars held daily, trading guides to help you improve trading performance, and one specifically for those who are new to forex.
---Written by Paul Robinson, Market Analyst
To receive Paul’s analysis directly via email, please SIGN UP HERE
You can follow Paul on Twitter at @PaulRobinsonFX


