


What’s inside:
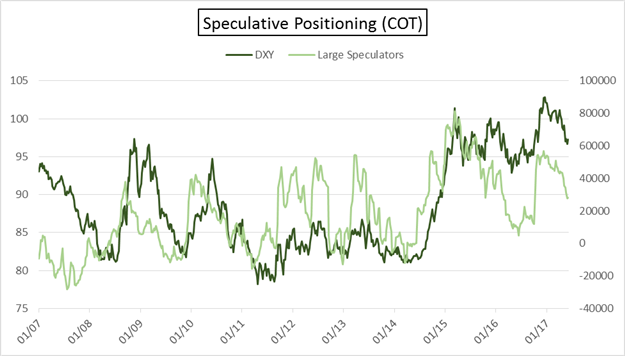
- Euro traders add once again to net long position, but reaches an extreme
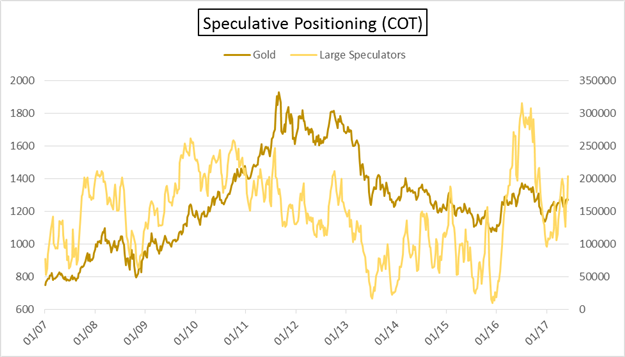
- Gold large speculators add at critical juncture, could be fuel for selling if
- Australian dollar and British pound also see pause in recent trends in positioning
Find out what’s driving FX, equity markets, and commodities in our market forecasts.
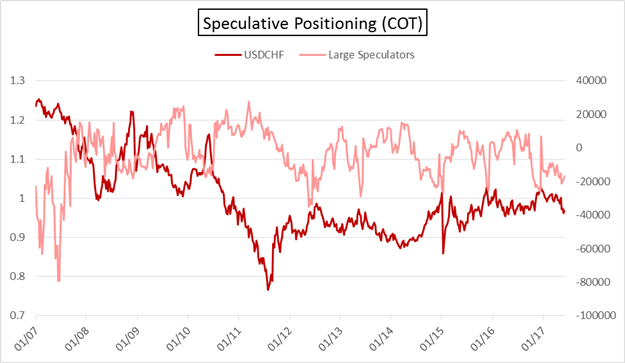
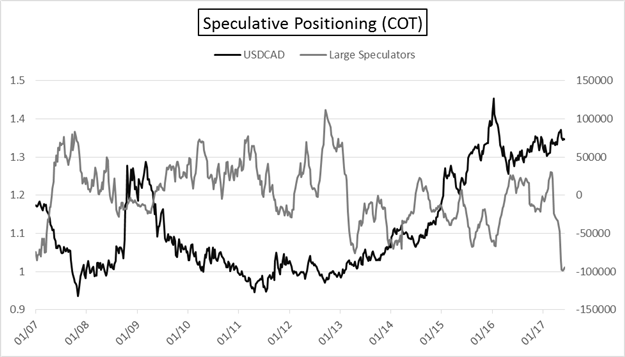
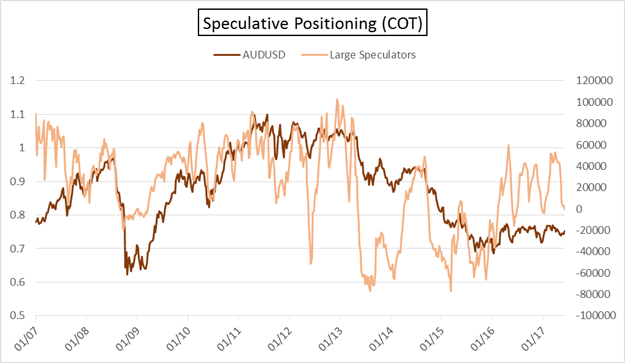
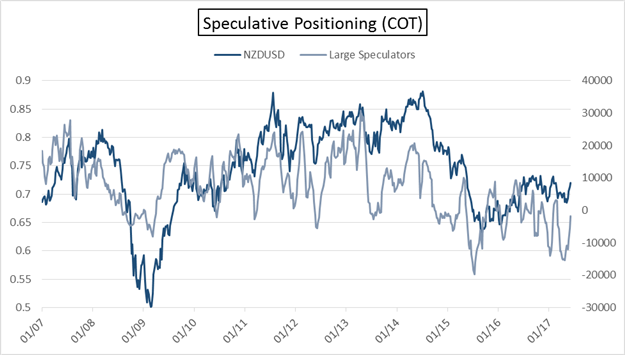
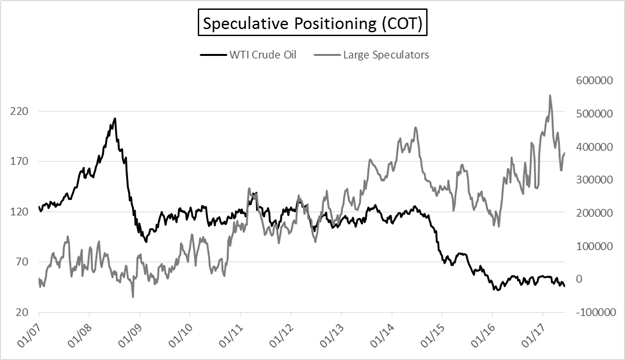
The Commitment of Traders (COT) report released each Friday shows market positioning of futures traders as it stands for the week ending Tuesday. Shown in the table below are the net positions of large speculators (i.e. hedge funds, CTAs, etc.), the change from the prior week, and where the net position stands relative to its 52-week range.
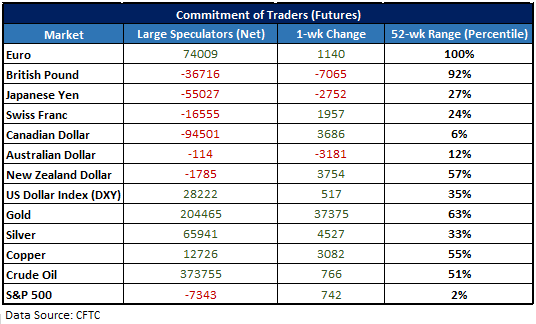
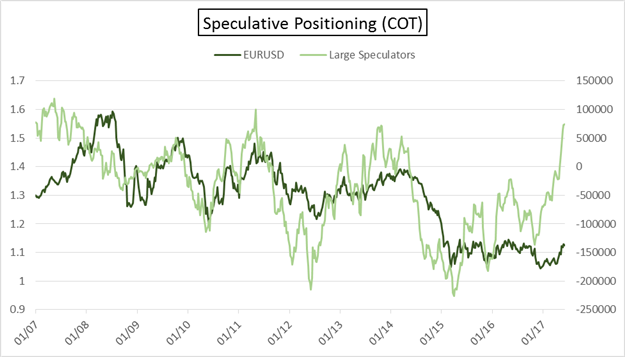
Notable developments: Euro large speculators add to their net long position for a 5th week in a row. As we’ve noted before they have a good track record over the very long run of capturing trends in this particular currency, and as of last month went net long for the first time since May 2014. But while they have been good at identifying trends, extremes in positioning can also indicate points of exhaustion. At 74009 contracts, this is the largest net long position since May 2011. A turn lower, to at least alleviate the build-up of speculative longs, may soon be in order.
Gold large specs added to their long positions for a fourth week in a row, pushing it to the largest net position since the week of November 11. This came at a time when the price of gold pushed above the all-important 2011 trend-line on a daily closing basis. But for the three days to end last week, gold dropped back below and put in a key reversal bar on the weekly. The selling pressure will likely be reflected in this Friday’s report. As we’ve discussed recently, a weekly close above the long-term trend-line was viewed as the key event needed to put gold in the driver’s seat towards higher prices. Should we see further failure out of gold, the recently added longs could add fuel to a down-move as they unload losing positions.
The COT report is viewed as a longer-term indication of sentiment – for a shorter-term view on sentiment, check out IG Client Sentiment data and the guide on how to utilize this metric.
Paul conducts webinars every week from Tuesday-Friday. See the Webinar Calendar for details, and the full line-up of all upcoming live events.
---Written by Paul Robinson, Market Analyst
You can receive Paul’s analysis directly via email by signing up here.
You can follow Paul on Twitter at @PaulRobinonFX.


