


- USD specs near a net short position
- Another record ownership profile in gold
- Copper specs hold record net short position
For more analysis and trade setups, visit SB Trade Desk
Subscribe to Jamie Saettele's distribution list in order to receive several free reports per week
The COT Index is the difference between net speculative positioning and net commercial positioning measured. A blue colored bar indicates that the difference in positioning is the greatest it has been in 52 weeks (bullish) with speculators selling and commercials buying. A red colored bar indicates that the difference in positioning is the greatest it has been in 52 weeks (bearish) with speculators buying and commercials selling. Non-commercials tend to be on the wrong side at the turn and commercials the correct side. Use of the index is covered closely in detail in my book.
Latest CFTC Release dated June 14, 2016
| Week (Data for Tuesdays) | |
|---|---|
| US Dollar | 0 |
| Euro | 78 |
| British Pound | 28 |
| Australian Dollar | 69 |
| Japanese Yen | 80 |
| Canadian Dollar | 98 |
| Swiss Franc | 82 |
| Mexican Peso | 27 |
| Gold | 100 |
| Silver | 90 |
| Copper | 4 |
| Crude | 82 |
Charts (all charts are continuous contract)
Non Commercials (speculators) – Red
Commercials – Blue
Small Speculators – Black
COTDiff (COT Index) – Black
US Dollar ICEUS Continuous Contract
Chart prepared by Jamie Saettele, CMT
Euro CME Continuous Contract

Chart prepared by Jamie Saettele, CMT
British Pound CME Continuous Contract

Chart prepared by Jamie Saettele, CMT
Australian DollarCME Continuous Contract
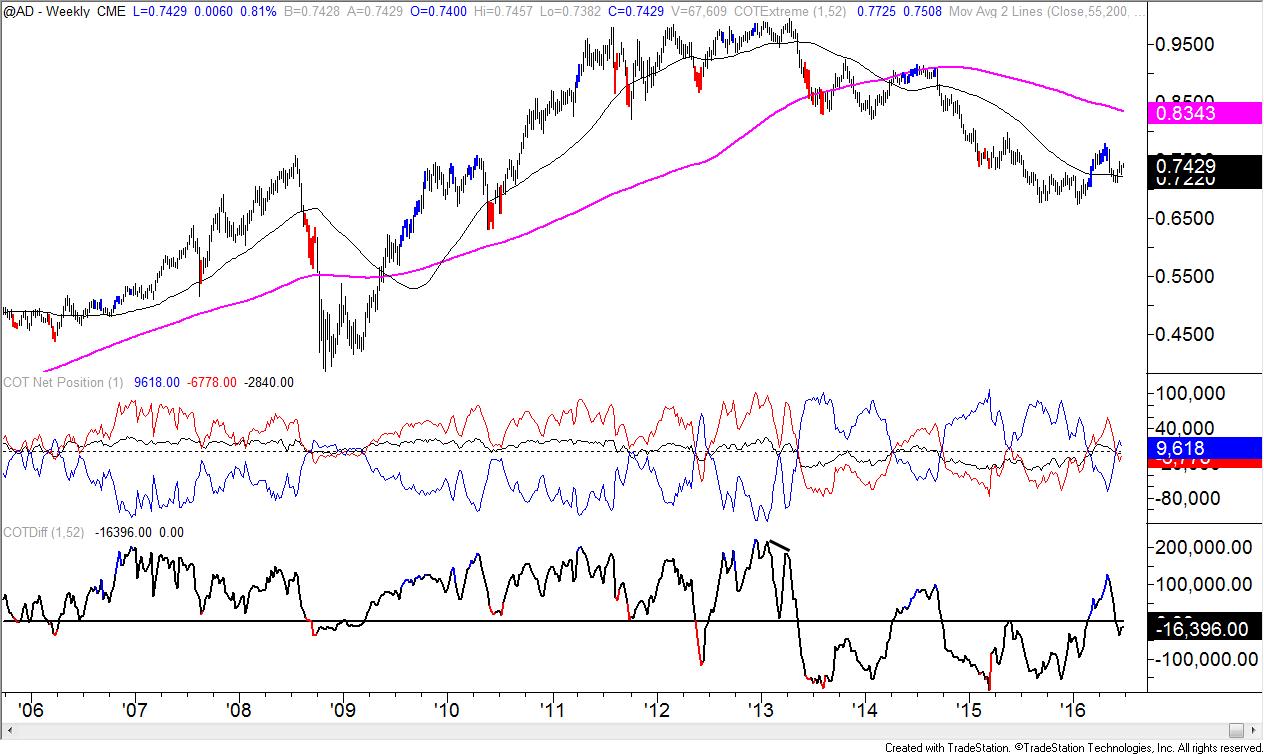
Chart prepared by Jamie Saettele, CMT
Japanese YenCME Continuous Contract

Chart prepared by Jamie Saettele, CMT
Canadian DollarCME Continuous Contract

Chart prepared by Jamie Saettele, CMT
Swiss Franc CME Continuous Contract

Chart prepared by Jamie Saettele, CMT
Swiss Franc CME Continuous Contract

Chart prepared by Jamie Saettele, CMT
The most recent COT data (as of 6/14) reveals that the 1 week net change in speculative-commercial positioning is large. Prior changes of this magnitude are shown with red dots. Think about this as follows, ‘the ownership profile for Swiss Francs just underwent an extreme change with speculators buying and hedgers selling.’ This type of activity can signal optimism extremes and therefore price highs.
Mexican Peso CME Continuous Contract

Chart prepared by Jamie Saettele, CMT
Gold COMEX Continuous Contract

Chart prepared by Jamie Saettele, CMT
Silver COMEX Continuous Contract

Chart prepared by Jamie Saettele, CMT
Copper COMEX Continuous Contract

Chart prepared by Jamie Saettele, CMT
Crude Oil NYMEX Continuous Contract

Chart prepared by Jamie Saettele, CMT
--- Written by Jamie Saettele, CMT, Senior Technical Strategist for DailyFX.com
To contact Jamie e-mail jsaettele@dailyfx.com. Follow me on Twitter for real time updates @JamieSaettele
Jamie is the author of Sentiment in the Forex Market and co-founder of SB Trade Desk.


