


Gold Price (XAU/USD), Chart, and Analysis
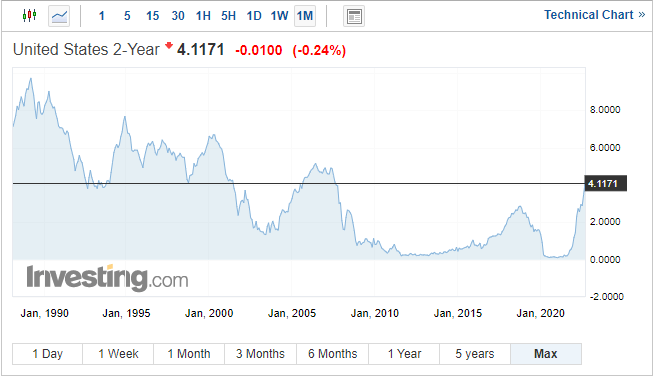
- US Treasury 2-year yields hit 4.25%.
- Support looks set to be tested again.
- Retail traders trim their long positions.

Gold has been stuck in a rut for the last week with any attempted break higher met with more forceful opposition. Gold is battling higher US Treasury yields, especially in the interest-rate sensitive short-end, that continue to dull the allure of the precious metal. The current situation is nothing new as UST yields have been rallying for months, but with little to no bullish impulses for gold, lower prices are likely.
The UST 2-year traded with a yield of 4.25% Thursday, yet another multi-year high. With the Fed’s interest-rate mantra of higher, faster, and longer, bond yields are expected to climb further in the months ahead, although the speed and size of any further move are likely to be restricted. Markets expectations are for Fed Funds to top out around 4.50%-4.75% in H1 2023, leaving a limited amount of room for short-dated yields to move higher.
Trade Smarter - Sign up for the DailyFX Newsletter
Receive timely and compelling market commentary from the DailyFX team
For all market-moving data releases and events, see the DailyFX Economic Calendar.
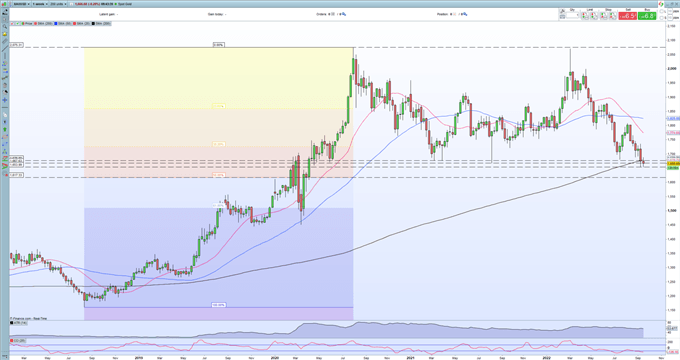
The weekly gold chart shows the precious metal testing support around $1,667/oz. again and a break below here leaves $1,617/oz. as the next technical target. The break below the 200-simple moving average is a fresh negative for gold.
Gold Weekly Price Chart – September 23, 2022
Retail trader data show 82.46% of traders are net-long with the ratio of traders long to short at 4.70 to 1. The number of traders net-long is 0.50% higher than yesterday and 10.29% lower from last week, while the number of traders net-short is 7.66% higher than yesterday and 27.45% higher from last week.
We typically take a contrarian view to crowd sentiment, and the fact traders are net-long suggests Gold prices may continue to fall. Yet traders are less net-long than yesterday and compared with last week. Recent changes in sentiment warn that the current Gold price trend may soon reverse higher despite the fact traders remain net-long.
| Change in | Longs | Shorts | OI |
| Daily | -2% | -2% | -2% |
| Weekly | 3% | 16% | 10% |
What is your view on Gold – bullish or bearish?? You can let us know via the form at the end of this piece or you can contact the author via Twitter @nickcawley1.


