


Gold Price (XAU/USD), Chart, and Analysis
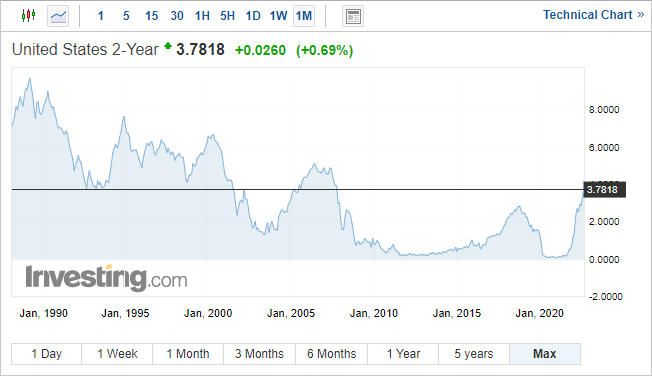
- Two-year US Treasury yields continue to soar.
- Gold eyes support below $1,700/oz.

Tuesday’s US inflation report showed that price pressures in America are not abating and that further rate hikes are needed. Yesterday’s report showed inflation rising on a month-on-month basis, surprising market participants who had priced-in and positioned for a move lower. Financial markets are now showing a 35% chance that there will be a 100 basis point rate hike at the September 21 meeting. These heightened expectations can be seen in the interest-rate sensitive Two-year US Treasury which is now trading with a 15-year high yield of 3.78%. Higher-for-longer Treasury yields will weigh on gold in the months ahead.
Trade Smarter - Sign up for the DailyFX Newsletter
Receive timely and compelling market commentary from the DailyFX team
For all market-moving data releases and events, see the DailyFX Economic Calendar.
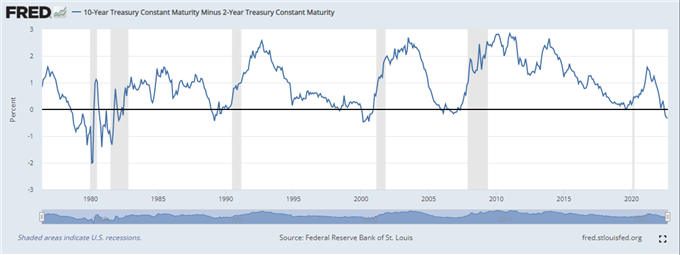
The Fed will also be watching the US Treasury 2-10 year yield spread, a closely followed recession indicator. The spread, negative 33 basis points, is 10 basis points away from the multi-year low made on August 8 this year.
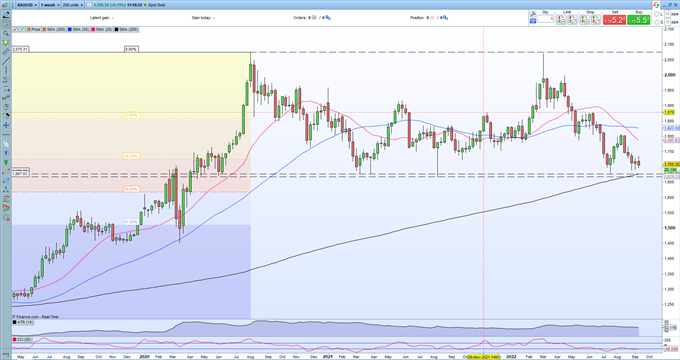
The weekly gold chart shows support at just under $1,700/oz. holding sellers at bay for now. A cluster of prior lows all the way down to $1,667/oz. will likely stem any sell-off although this will leave a gap back to the 50% Fibonacci retracement level at $1,618/oz vulnerable. Recent weekly highs at $1,736/oz. and $1,746/oz. should keep a lid on prices in the near term.
Gold Weekly Price Chart – September 14, 2022
Retail trader data show 87.77% of traders are net-long with the ratio of traders long to short at 7.18 to 1. The number of traders net-long is 6.78% lower than yesterday and 7.72% higher from last week, while the number of traders net-short is 3.89% lower than yesterday and 22.82% lower from last week.
We typically take a contrarian view to crowd sentiment, and the fact traders are net-long suggests Gold prices may continue to fall. Positioning is less net-long than yesterday but more net-long from last week. The combination of current sentiment and recent changes gives us a further mixed Gold trading bias.
| Change in | Longs | Shorts | OI |
| Daily | -4% | 6% | 1% |
| Weekly | 9% | -12% | -2% |
What is your view on Gold – bullish or bearish?? You can let us know via the form at the end of this piece or you can contact the author via Twitter @nickcawley1.


