


- DAX 40:Marginal Gains as it Attempts to Recover Yesterday’s Losses.
- FTSE 100:Extends losses as Markets Remain Rattled, Inflation Eases.
Foundational Trading Knowledge
Understanding the Stock Market
Recommended by Zain Vawda
DAX 40: Marginal Gains as it Attempts to Recover Yesterday’s Losses
The DAX made modest gains in European trade as it looked to recover some of yesterday’s losses. The index joined global equities in a rout following yesterday’s US CPI print, with belief that the FED will remain hawkish for longer. Gains made toward the back end of last week and early this week were surrendered as we approach the 13000 key level once more.
The Eurozone reported a sharp drop in industrial production reversing gains made in the months of May and June. Germany, Spain and France were among the countries to see a significant drop in production while supply constraints remain an issue. The outlook moving forward paints a grim picture with supply problems persisting and energy prices now affecting other industries coupled with a slowdown in new orders; don’t expect a jump in production anytime soon. This will surely weigh down on companies in the Eurozone as we head toward the end of year and will no doubt have an impact on profitability of listed companies on the index.
On the energy front, Germany is now considering the prospect of nationalizing embattled power utility provider Uniper SE in a bid to ensure energy stability moving forward. The utility suffered a loss of around EUR12 billion in the first half of the year. Uniper which has already received assistance from the government requires further help. The government took a 30% stake in July following the rescue package with consideration now for a 50% stake or complete nationalization. Shares in Uniper declined as much as 10% during the session.
DAX 40 Daily Chart –September 14,2022
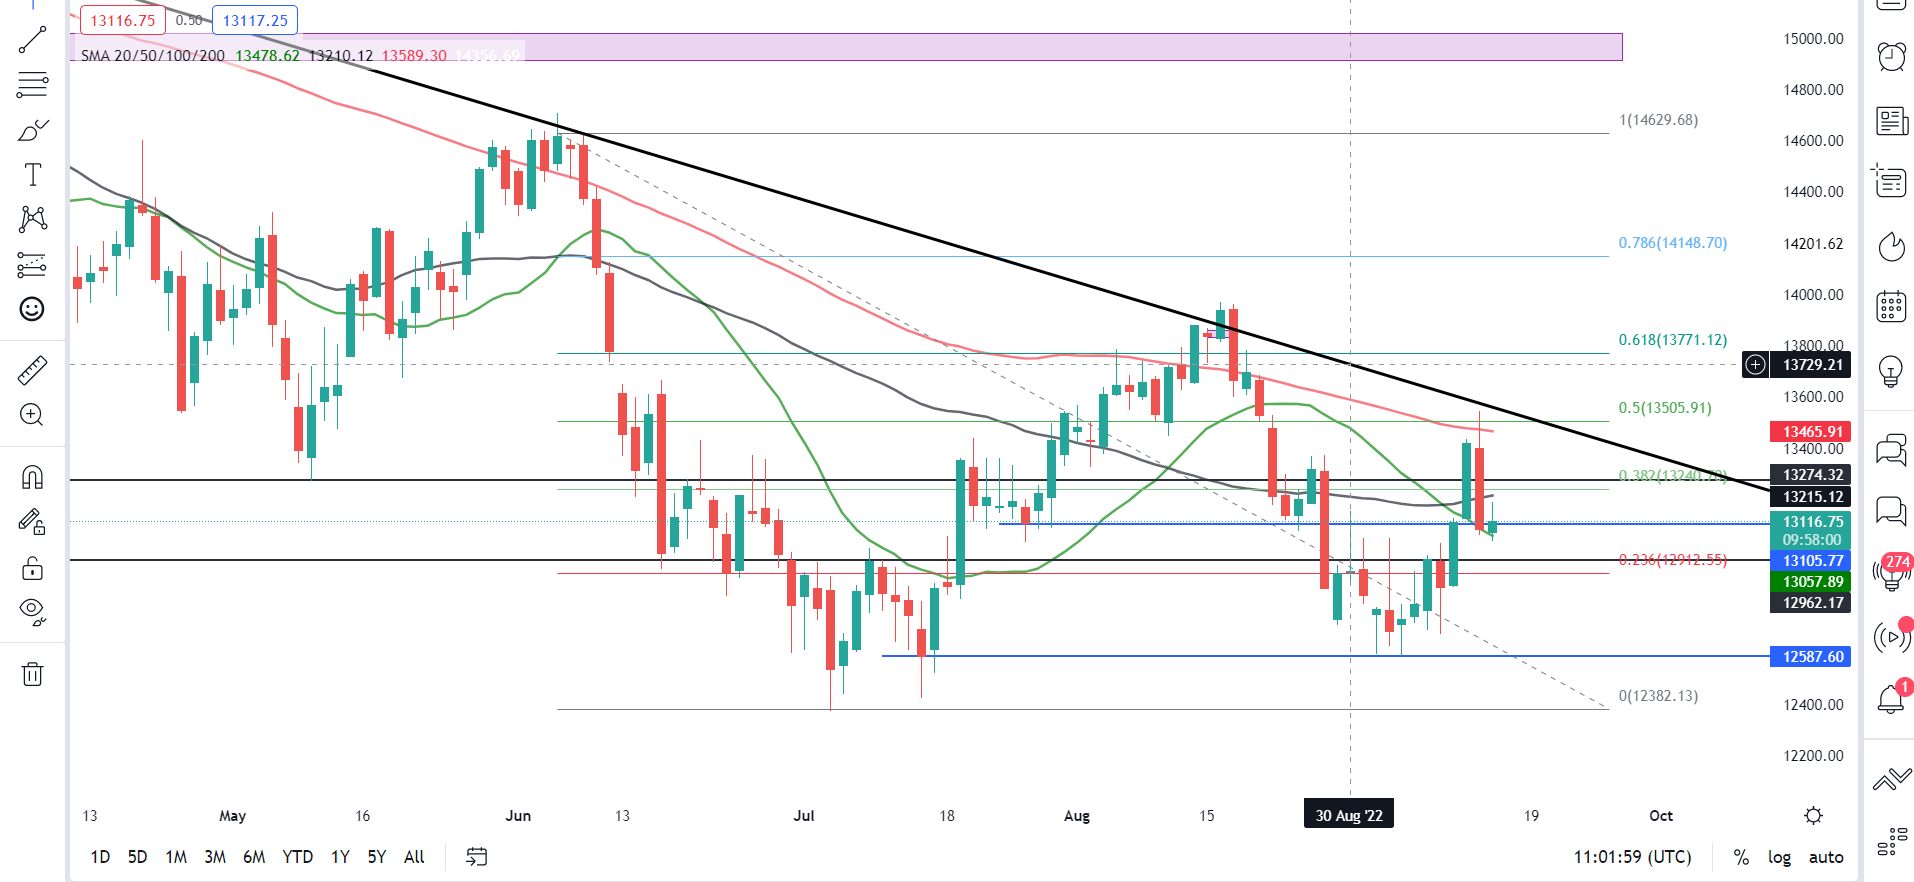
Source: TradingView
From a technical perspective, last week’s bullish close was followed up with early week gains. However, yesterday saw sentiment shift which lined up with a host of technical confluences. We saw a selloff of around 480 points which coincided with the 50% fib level, trendline as well as the 100-SMA. The daily candle close as a bearish engulfing candlestick hinting at further downside as the 13000 key level now back in touching distance.
Key intraday levels that are worth watching:
Support Areas
- 13050
- 12912
- 12785
Resistance Areas
- 13275
- 13475
- 13550
Psychological Levels and Round Numbers in Trading
FTSE 100:Extends losses as Markets Remain Rattled, Inflation Eases
The blue-chip index struggled to post any gains in European trade even with a decline in UK inflation numbers, an indication of the dominance of the macro environment at the moment. UK core inflation ticked up marginally which is a sign that inflation may be embedded across the economy. Meanwhile, London house prices continued their upward trajectory even in the face of rising inflation and a cost-of-living surge. The average home price jumping by 9% for the year, its fastest pace since 2016. On a national level prices are rising at their fastest pace since May 2003, according to the Office of National Statistics.
The index remains under pressure and rangebound as we struggle to find a long-term direction. As data releases and overall market sentiment continue driving the moves, next week’s central bank meeting may clear up the longer-term picture.
Introduction to Technical Analysis
Support and Resistance
Recommended by Zain Vawda
FTSE 100 Daily Chart –September 14,2022
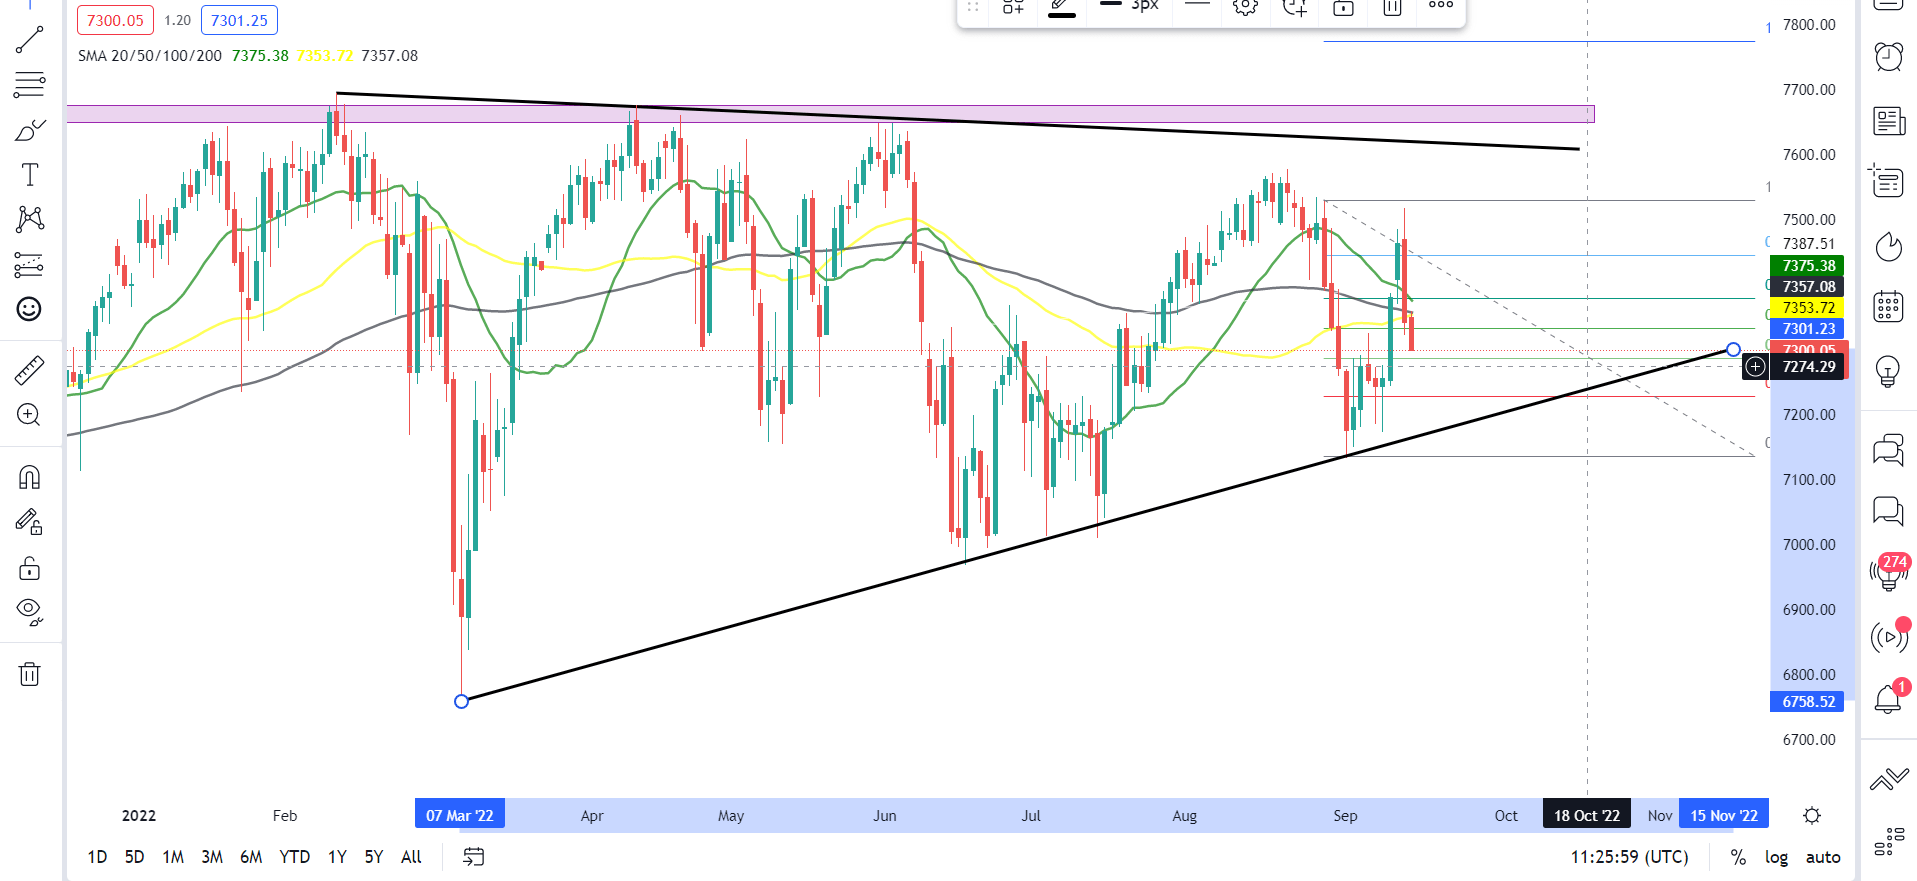
Source:TradingView
The FTSE remains under pressure following yesterday’s bearish engulfing close on the daily timeframe keeping the index within its range. The range between 7600 and 7000 has been strong, with choppy price action to boot. We have seen a higher low followed by a lower high as price action gives mixed signals on the higher timeframes. We trade back below the 20,50 and 100-SMA at the moment with strong support areas resting below 7300 area. Traders may find better value in looking at lower timeframes as the daily timeframe remain choppy.
Trading Ranges with Fibonacci Retracements
Key intraday levels that are worth watching:
Support Areas
- 7274
- 7231
- 7170
Resistance Areas
- 7333
- 7379
- 7446
| Change in | Longs | Shorts | OI |
| Daily | -25% | 12% | -1% |
| Weekly | 29% | -12% | -4% |
Resources For Traders
Whether you are a new or experienced trader, we have several resources available to help you; indicator for tracking trader sentiment, quarterly trading forecasts, analytical and educational webinars held daily, trading guides to help you improve trading performance, and one specifically for those who are new to forex.
Written by: Zain Vawda, Market Writer for DailyFX.com
Contact and follow Zain on Twitter: @zvawda


