GBP/USD - Prices, Charts, and Analysis
- Sterling is likely to remain weak in the short term.
- PM Truss to announce energy price cap details.

The British Pound hit a near four-decade low against the US dollar on Wednesday, prompting fears of further falls ahead. Testifying before the Treasury Select Committee yesterday, Bank of England governor Andrew Bailey undermined Sterling when he said that the upcoming energy price cap, to be announced by PM Truss today, would help slow inflation. This would leave the central bank with some wiggle room when looking at upcoming rate hikes. Interest rate-sensitive 2-year UK gilts lost over 25 basis points of yield in quick order, weakening Sterling against a range of currencies.
British Pound Latest – GBP/USD Still Looks Likely to Re-Test Lows
For all market-moving economic data and events, refer to the DailyFX calendar
Cable is not just weakening due to Sterling’s woes. The US dollar hit a fresh two-decade high on Wednesday and looks set to move even higher. Ahead of the Fed blackout period starting this weekend, a range of Fed speakers have been telling the market that the central bank will continue to hike, and hike hard if needed, to bring inflation under control. Any short-term weakness in the greenback may provide a medium-term, bullish opportunity.
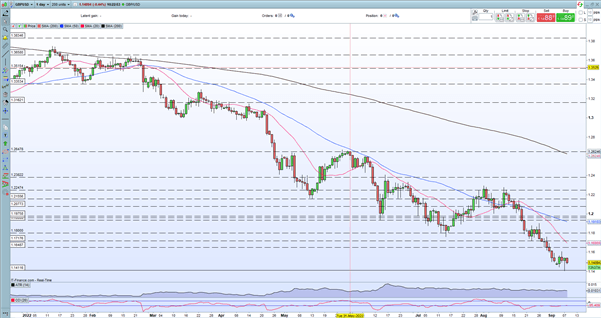
GBP/USD is back below 1.1500 and may likely re-test Wednesday’s multi-decade low in the coming sessions. The daily chart has no real bullish features or signals to speak of with a series of lower highs and lower lows dominating the landscape. Wednesday’s bullish hammer candle may signal a trend reversal but this may take a few days to see if it plays out.
Trading the Bullish Hammer Candle
GBP/USD Daily Price Chart – September 8, 2022
Retail trader data show 79.10% of traders are net-long with the ratio of traders long to short at 3.79 to 1. The number of traders net-long is 0.76% lower than yesterday and 6.41% higher from last week, while the number of traders net-short is 6.75% higher than yesterday and 31.77% higher from last week.
We typically take a contrarian view to crowd sentiment, and the fact traders are net-long suggests GBP/USD prices may continue to fall. Yet traders are less net-long than yesterday and compared with last week. Recent changes in sentiment warn that the current GBP/USD price trend may soon reverse higher despite the fact traders remain net-long.
| Change in | Longs | Shorts | OI |
| Daily | -3% | 11% | 1% |
| Weekly | 4% | -2% | 2% |
What is your view on the British Pound – bullish or bearish?? You can let us know via the form at the end of this piece or you can contact the author via Twitter @nickcawley1.