


US Dollar Price and Chart Analysis
- The Bank of Japan is watching the FX market with interest.
- US NFPs could provide the next driver for the US dollar.

The Japanese Yen is trading at a fresh 24-year low against the US dollar as the short-term yield spread between the two countries continues to widen. Two-year Japanese bonds are currently trading with an 8bp negative yield, while the US two-year offers a meaty 3.51%, its highest level in 15 years. This gulf in yields, caused by the ever-widening monetary policy stance of the two countries, will eventually force the Bank of Japan into acting to stem the Yen’s weakness otherwise the countries’ trade partners will start questioning whether Japan is actively keeping its currency artificially low. The Japanese central bank has already started to warn the market that they are closely watching the exchange rate, but actions, not words will be needed to stop this move.
Bank of Japan (BoJ) – Foreign Exchange Market Intervention
For all market moving data releases and economic events see the real-time DailyFX Calendar.
The latest US Jobs Report (NFP) will be released at 12:30 GMT today and will the market the latest look at the state of the US labor market. Current market expectations are for 300k new jobs to have been created in August, compared to 528k in July.

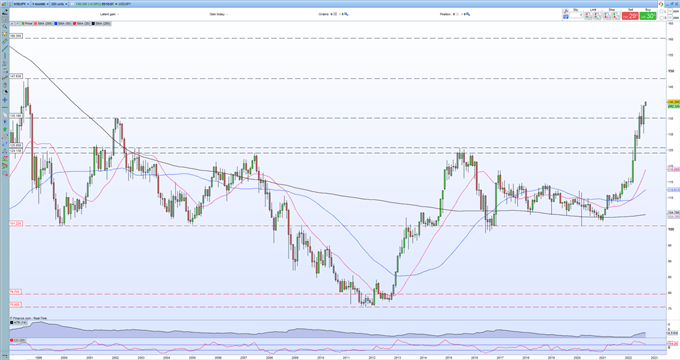
The monthly chart highlights the acceleration of the USDJPY move since March with the pair rallying by around 26 big figures or in excess of 22%. As with a lot of charts that see multi-decade moves, reliable short-term support and resistance levels can be difficult to find. The next level of resistance is likely the August 1998 high at 147.63, although there is likely to be a lot more verbal intervention from the BoJ before this level comes into play.
USD/JPY Monthly Price Chart – September 2, 2022
Retail trader data shows 23.61% of traders are net-long with the ratio of traders short to long at 3.24 to 1. The number of traders net-long is 4.03% lower than yesterday and 10.79% lower from last week, while the number of traders net-short is 3.38% higher than yesterday and 14.18% higher from last week.
We typically take a contrarian view to crowd sentiment, and the fact traders are net-short suggests USD/JPY prices may continue to rise. Traders are further net-short than yesterday and last week, and the combination of current sentiment and recent changes gives us a stronger USD/JPY-bullish contrarian trading bias.
| Change in | Longs | Shorts | OI |
| Daily | 6% | 2% | 3% |
| Weekly | -7% | 5% | 3% |
What is your view on the US Dollar – bullish or bearish?? You can let us know via the form at the end of this piece or you can contact the author via Twitter @nickcawley1.


