


ISM MANUFACTURING KEY POINTS:
- August manufacturing PMI unchanged at 52.8, topping expectations calling for a decline to 52.00
- ISM data suggests the sector remains resilient despite rising interest rates
- New orders and the employment index rebound, prices paid continue to moderate
Trade Smarter - Sign up for the DailyFX Newsletter
Receive timely and compelling market commentary from the DailyFX team
Most Read: Gold Price Forecast - Real Yields Up is Bad News - Levels for XAU/USD
A gauge of U.S. factory activity remained unchanged last month, defying the doom-and-gloom narrative and worst predictions, and easing fears that the country is headed for hard landing, undermined by the rising interest rates environment aimed at curbing rampant inflation.
According to the Institute for Supply Management (ISM), August manufacturing PMI clocked in at 52.8, the same reading as recorded in July, expanding for the 27th consecutive month and beating expectations calling for a decline to 52.00, a sign that the economy remains resilient despite numerous headwinds. For context, any figure above 50 indicates growth, while readings below that level denote a contraction in output.
Looking at the performance of some of the survey components, the goods producing sector was boosted by a moderate bounce in new orders, which jumped from 48.0 to 51.3, a move that suggests that demand conditions may be improving at the margin. Production, however, slumped to 50.4 from 53.5, limiting the recovery in the headline index. Elsewhere, the employment metric surged 4.3 points to 54.2, reinforcing the view that the labor market remains hot, with no major layoffs to account for yet.
ISM MANUFACTURING RESULTS
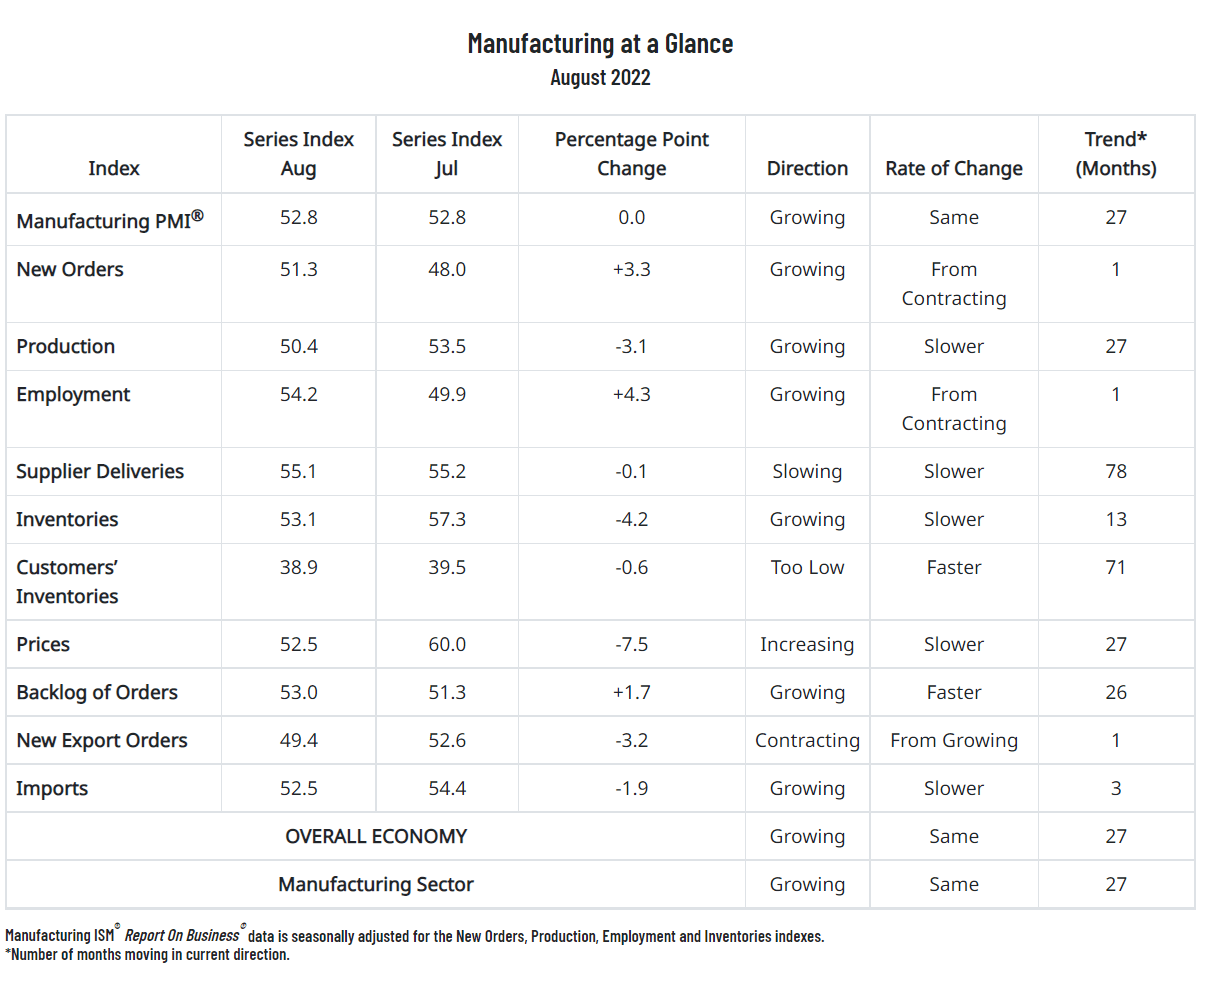
Source: Institute for Supply Management
Overall, most of the details in today’s report were positive, but some more than others. For instance, the prices paid index continued to ease, sliding 7.5 points to 52.5, indicating that raw materials costs are growing at a much slower pace than in previous months. This trend, if sustained, could translate into lower CPI readings later this year, reducing the need for forceful and front-loaded Fed hikes.

While the central bank could become less aggressive in the future, policymakers have indicated in no uncertain terms that they will not pivot to a rate cutting cycle until there is convincing evidence that inflation is headed back to the 2% target. That is not likely to happen soon.
Tighter monetary policy for an extended period at a time of slowing activity may create a hostile environment for stocks and risk appetite, paving the way for turbulence and unpredictable bouts of high volatility on Wall Street. In this environment, both the S&P 500 and Nasdaq 100 will struggle to mount a meaningful and durable recovery.
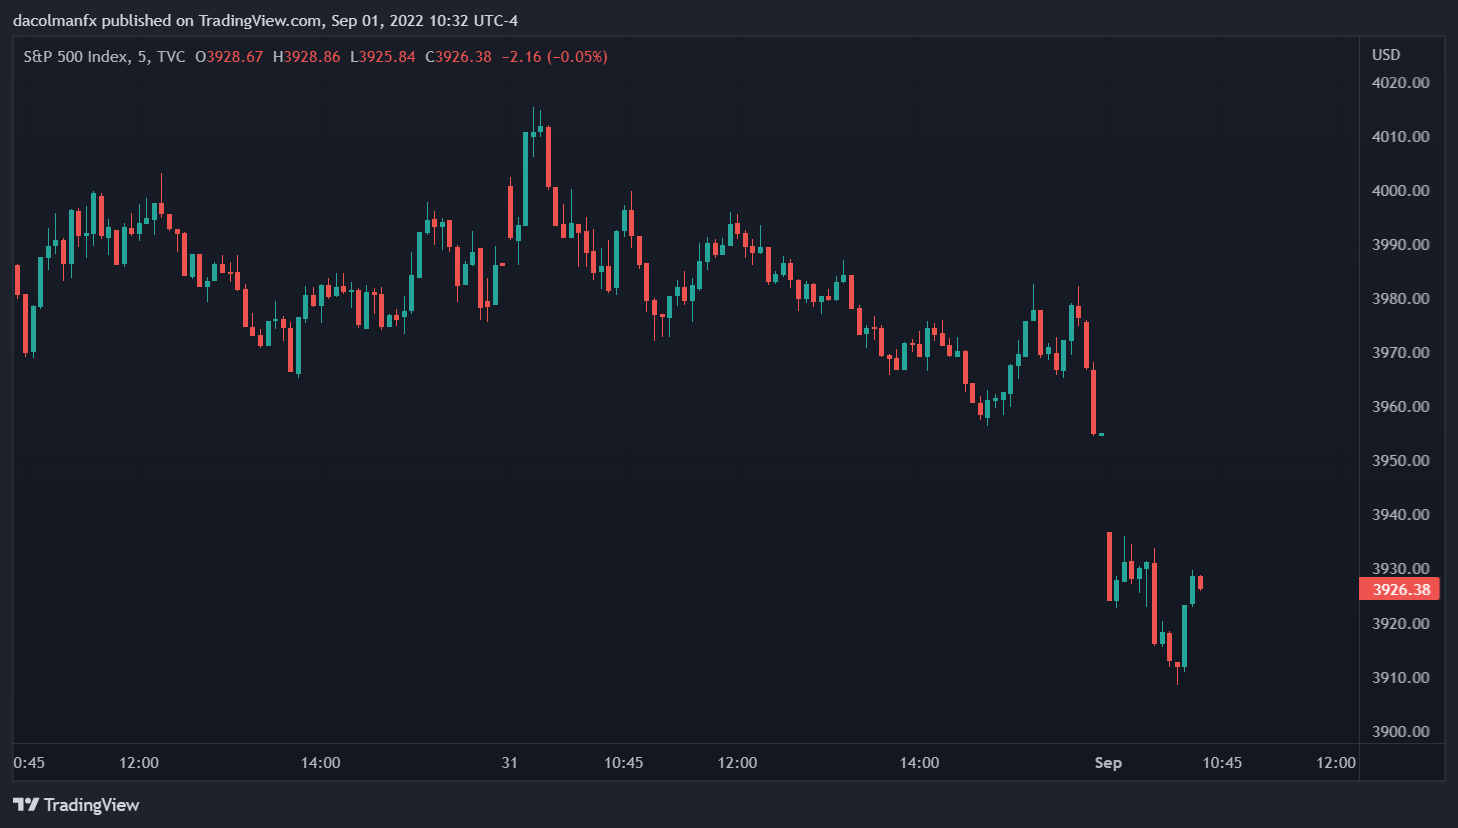
The S&P 500 maintained a negative bias following the ISM results, as the better-than-expected data boosted U.S. Treasury yields and bolstered the argument that the economy remains healthy enough to tolerate a restrictive policy stance for longer. With growth not yet collapsing, the Fed will have no reason to adopt a dovish stance in the near term.
S&P 500 5 MINUTES CHART
EDUCATION TOOLS FOR TRADERS
- Are you just getting started? Download the beginners’ guide for FX traders
- Would you like to know more about your trading personality? Take the DailyFX quiz and find out
- IG's client positioning data provides valuable information on market sentiment. Get your free guide on how to use this powerful trading indicator here.
---Written by Diego Colman, Market Strategist for DailyFX


