


Dow Jones Index (DJI) Talking points:
- Wall Street extends losses as US Dollar strength dominates markets
- Dow Jones futures dragged down by rate expectations
- DJI futures cling to 32,000 psychological level as participants continue to price in fundamentals

Dow Jones Index (DJI) Futures Weighed Down by Stronger Dollar
Dow futures gapped lower on the open as the sell-off in global equities gained traction. With US Dollar strength returning with vengeance, major stock indices relinquished August’s gains, pushing Wall Street futures back towards the key psychological level of 32,000.
The shift in sentiment comes after Fed Chair Jerome Powell confirmed the central bank’s intention to continue to raise rates aggressively until the target inflation rate of 2% is within range. After addressing key policymakers at last week’s annual Jackson Hole Economic Symposium, the probability of a third consecutive 75 basis point rate hike in September rose, driving US yields higher.
Monitor central bank announcements via the central bank calendar
Dow Jones Index (DJI) Technical Analysis
At the time of writing, Dow price action has been muted by the 50-day MA (moving average) which coincides with the 32,000-psych level mentioned above. If bears manage to drive prices lower, the 31,867 handle which capped the July move may come back into play.
Dow Jones Index (DJI) Daily Chart

Chart prepared by Tammy Da Costa using TradingView
Meanwhile, Fibonacci levels from historical moves will likely continue to provide additional layers of support and resistance for Wall Street’s next move.
Visit DailyFX Education to Learn More About the Benefits of Multiple-Time Frame Analysis
After falling below 32,408 (the 23.6% Fibonacci of the 2020 – 2022 move), the four-hour chart below highlights the tight range that has developed after a brief retest of 31,976 earlier today. With the RSI currently trading in oversold territory, selling pressure could allow bears to continue to drive price action lower.
Dow Jones FuturesFour-Hour Chart
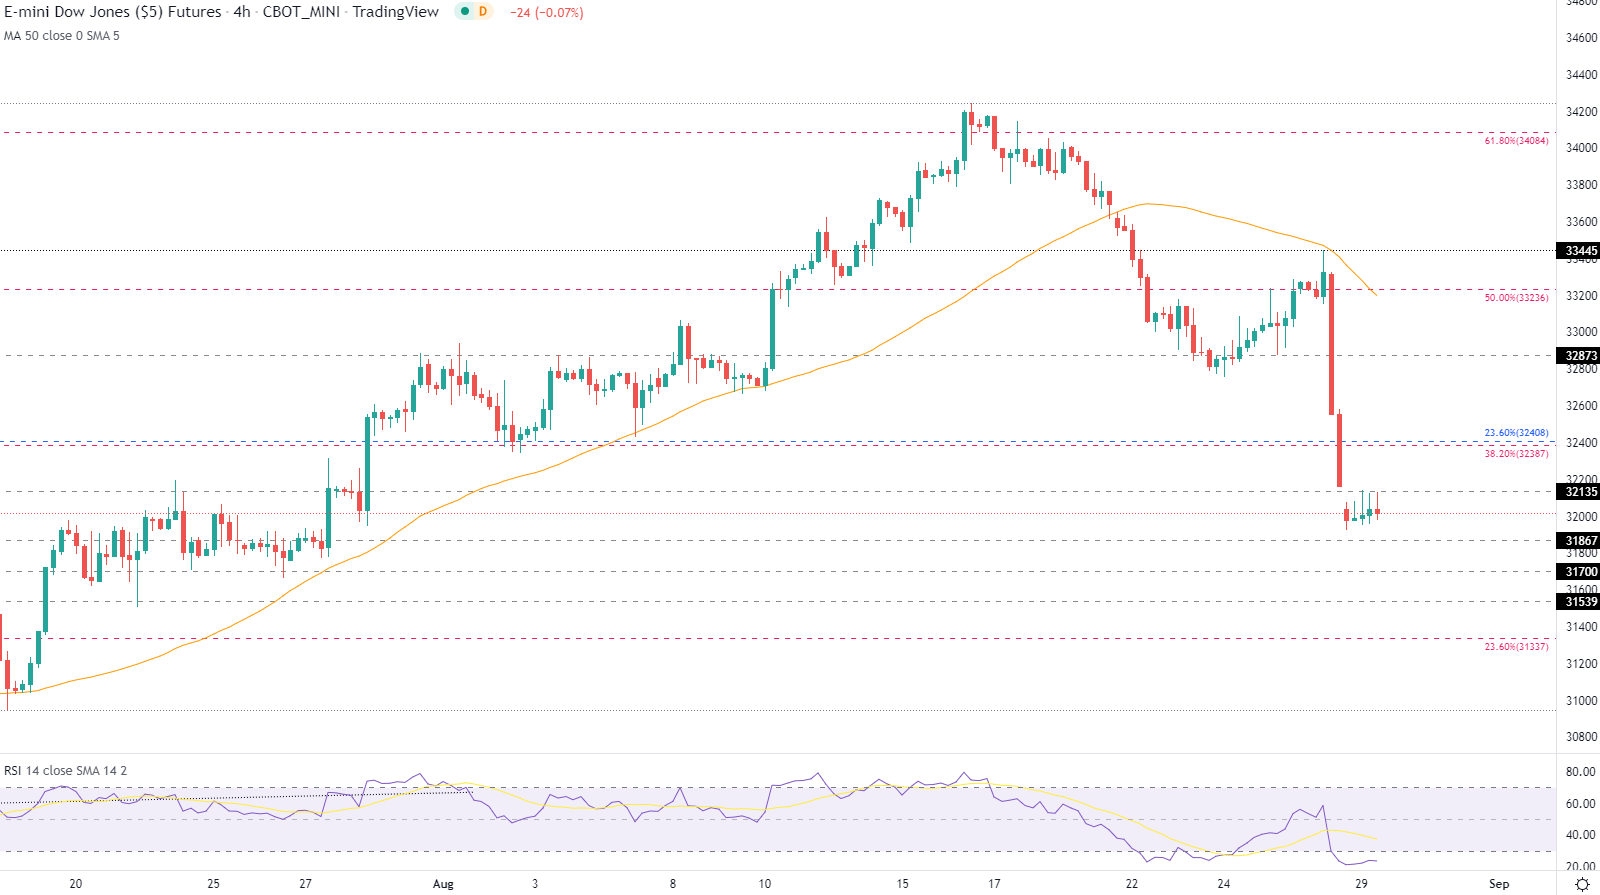
Chart prepared by Tammy Da Costa using TradingView
Dow Jones Index Biggest Movers
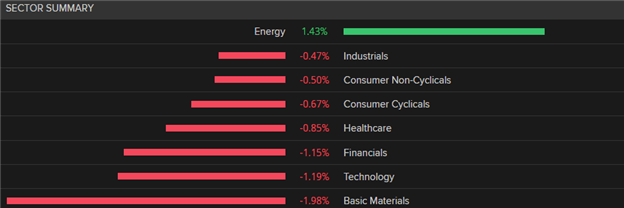
Source: Refinitiv
| Change in | Longs | Shorts | OI |
| Daily | 10% | -5% | 0% |
| Weekly | -12% | 10% | 0% |
Dow Jones (DJI) Key Levels
| Support | Resistance |
|---|---|
| S1: 31,867 | R1: 32,387 (38.2% Fib of 2022 move) |
| S2: 31,700 (psych level) | R2: 32,408 |
| S3: 31,337 (23.6% Fib of 2022 move) | R3: 32,800 |
--- Written by Tammy Da Costa, Analyst for DailyFX.com
Contact and follow Tammy on Twitter: @Tams707


