


FTSE 100, DAX 40, DJIA Overview:
- FTSE 100 resilient despite stumbling Sterling (GBP)
- DAX 40 futures ramp up losses as prices plunge towards 13,000
- Dow Jones tests prior resistance turned support at 33,236
FTSE 100 is trading sideways as UK equities remain restrained. With price action showing limited motion, both psychological and fibonacci levels have highlighted important zones that continue to provide support and resistance for the major stock index.

As market participants continue to assess the fundamental backdrop, a bleak economic outlook has weighed heavily on the British Pound (GBP) but has done little to deter the FTSE. With rate hikes, war, and energy prices limiting the upside move, UK stocks remain vulnerable to changes in the inflation narrative as well as to rising risks of an unavoidable recession.
With prices still struggling to find a fresh catalyst for momentum, the 14.4% fibonacci of the June move (in blue) has formed a firm layer of resistance at 7,553 with the next big level holding at 7,600.
Introduction to Technical Analysis
Learn Technical Analysis
Recommended by Tammy Da Costa
FTSE 100 Daily Chart
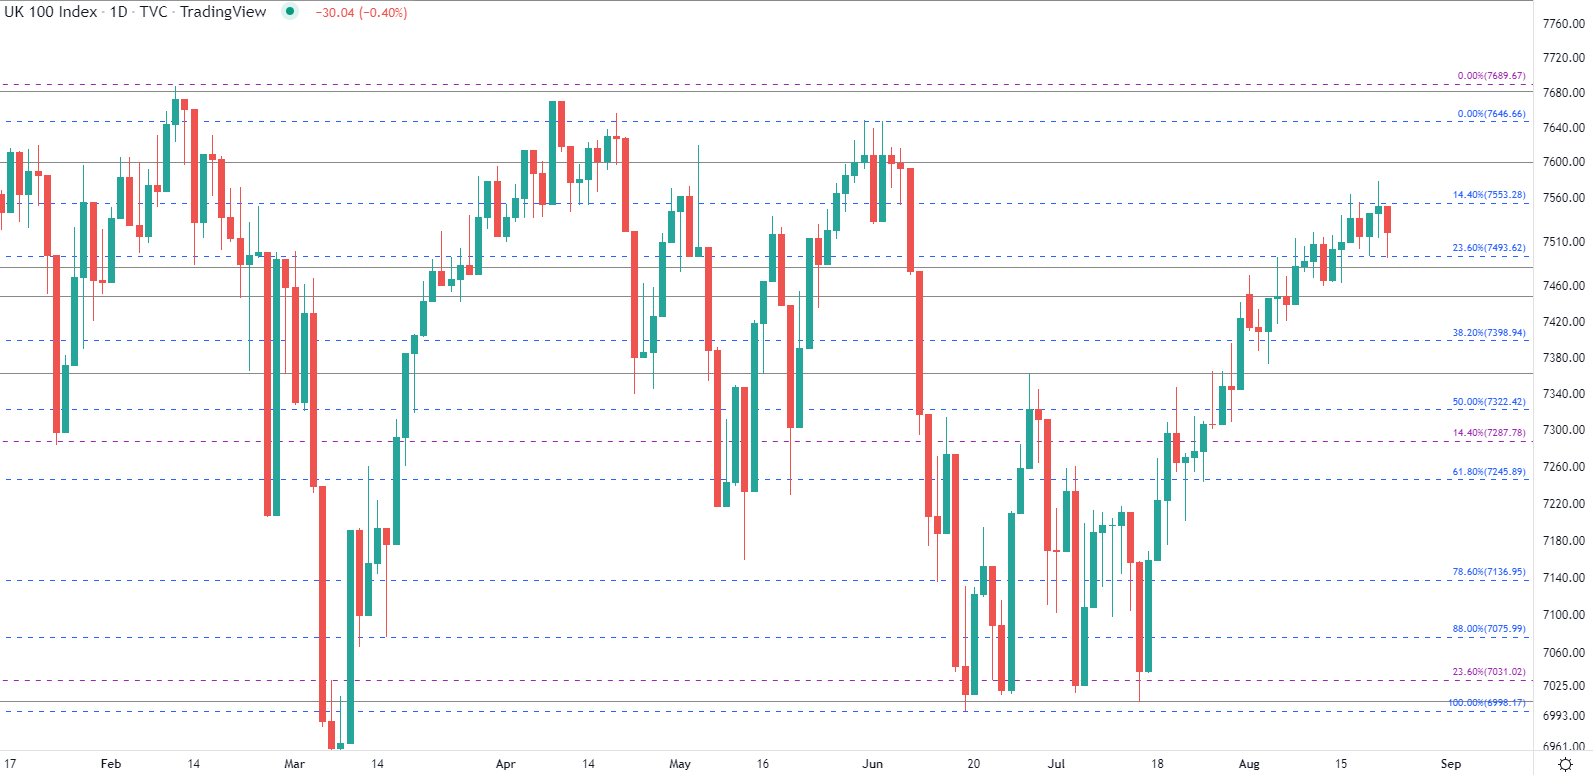
Chart prepared by Tammy Da Costa using TradingView
Although heightened volatility contributed to the extreme fluctuations in price action and has since subsided, a break of the above-mentioned levels may allow FTSE 100 to retest the June high at around 7,646 followed by the February high at 7,689.
For the downside move, increased selling pressure below 7,400 brings the next level of support to 7,287. A break below both levels may then raise the likelihood for a retest of 7,000.
FTSE 100 Key Levels
| Support | Resistance |
|---|---|
| 7,493 (23.6% retracement of the June move) | 7,553 (14.4% retracement from June |
| 7,400 psych level | 7,600 psychological level |
| 7,287 (14.4% retracement of Feb – March 2020 move) | 7,646 (June high) |
DAX 40 Technical Analysis
Dax futures have been less resilient than their UK counterparts after falling more than 2% today. With the descending trendline from the January high capping the upside move, the 23.6% Fib of the Jan – July move is providing imminent support at 13,161. If the 13,000 spot fails to hold bears at bay, an increase in bearish momentum may result in a more aggressive move towards the March low at 12,425.

Dax Futures Daily
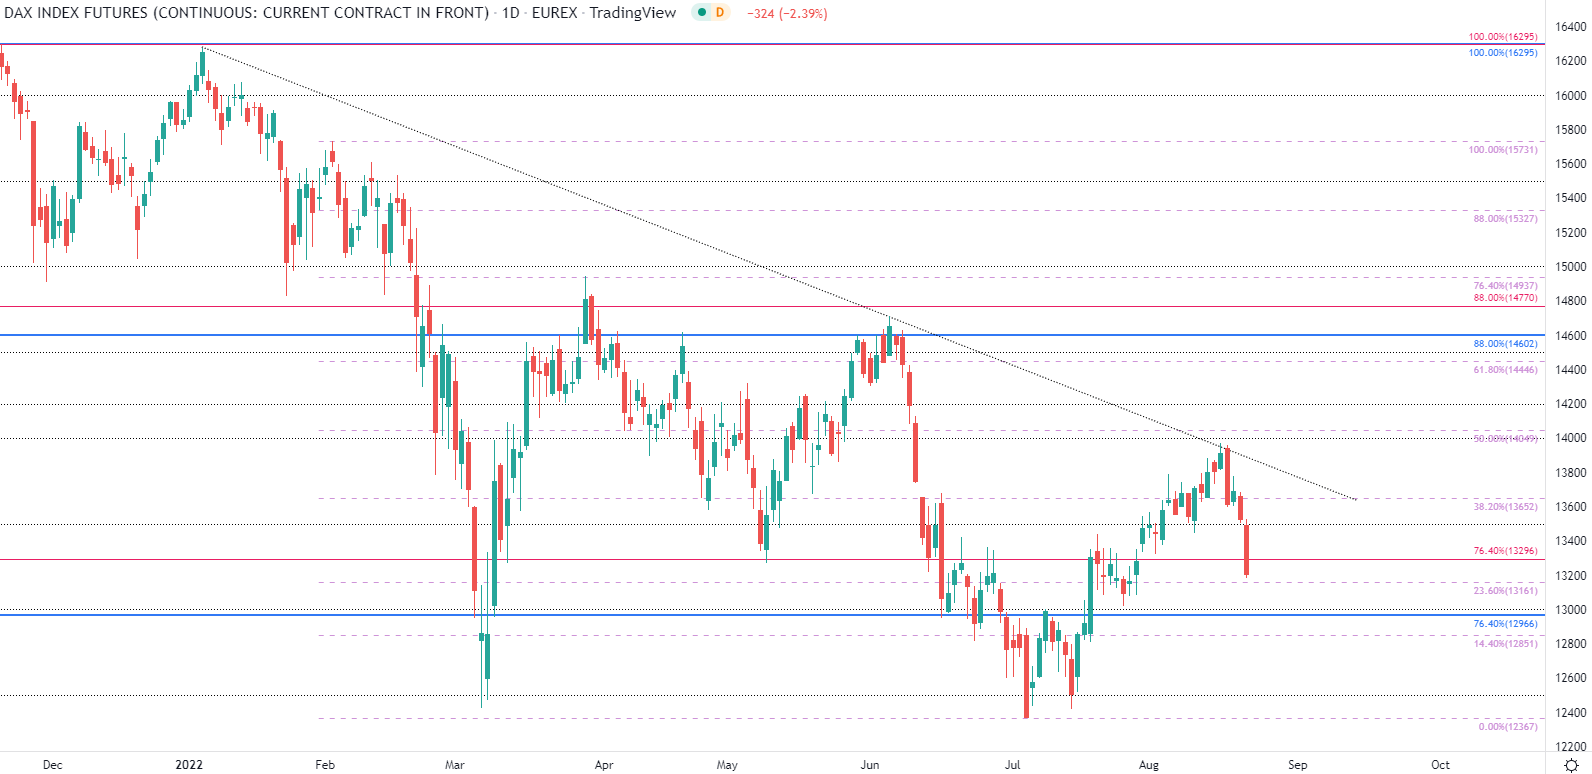
Chart prepared by Tammy Da Costa using TradingView
Dow Jones Industrial Average (DJIA)
For the Dow Jones Industrial Index (DJI), price action has fallen below the 200-day MA (moving average) at 33,776 with the 61.8% retracement of the Jan – June move providing an additional barrier of resistance at 34,084. With prices currently threatening the 50% mark of that same move at 33,236, a break of prior resistance turned support may allow for a retest of the August lows at 32,387.
DJI Futures Daily Chart
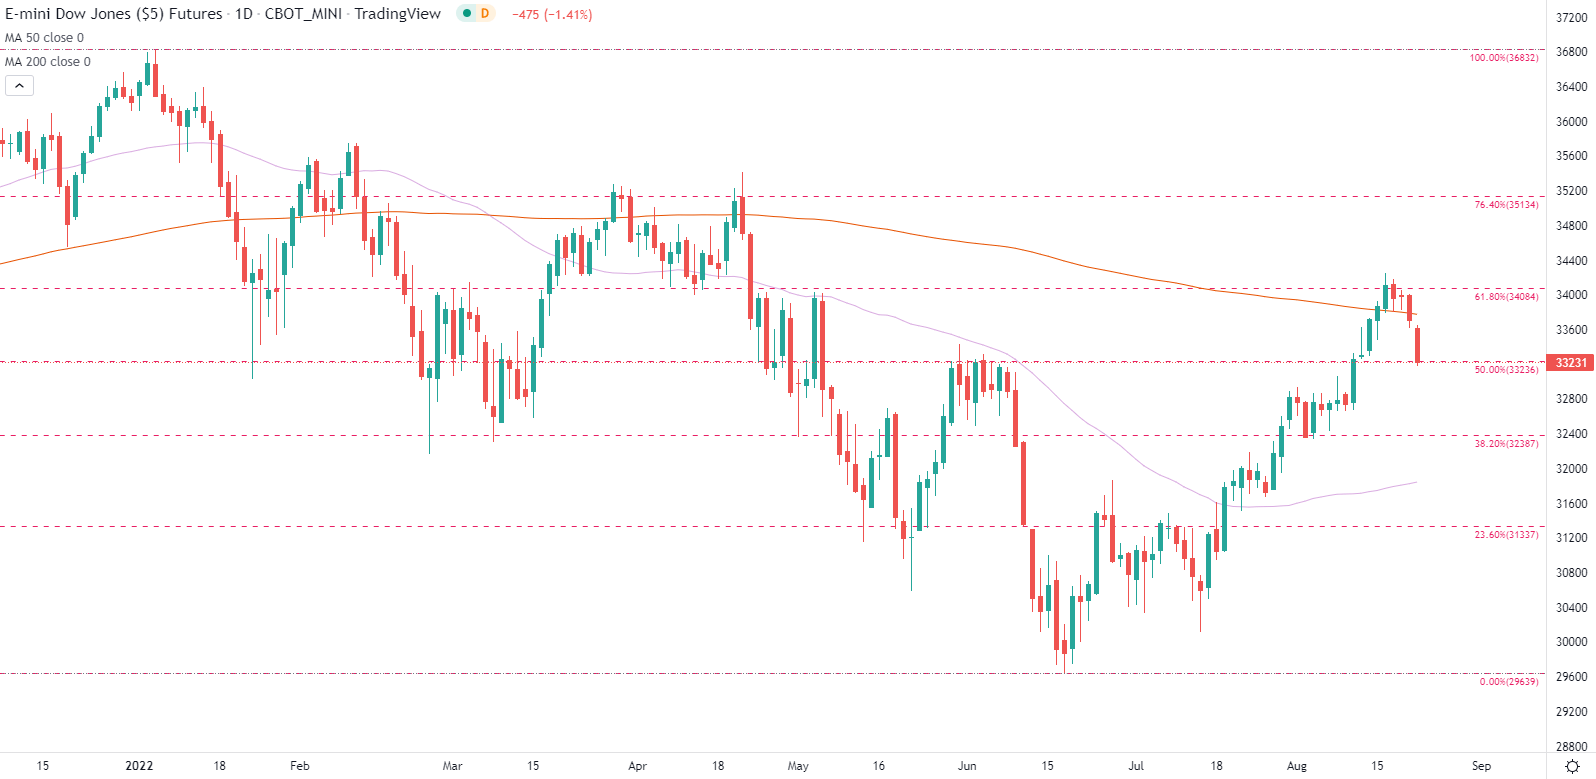
Chart prepared by Tammy Da Costa using TradingView
| Change in | Longs | Shorts | OI |
| Daily | -11% | 15% | 3% |
| Weekly | -14% | 12% | -1% |
--- Written by Tammy Da Costa, Analyst for DailyFX.com
Contact and follow Tammy on Twitter: @Tams707


