


DAX 40, CAC 40, FTSE 100 Talking Points:
- DAX 40 treads cautiously around psychological resistance
- CAC 40 confined to Fibonacci support
- FTSE 100 benefits from positive earnings but risk sentiment caps gains

DAX futures are trading marginally lower alongside the Europe’s STOXX 50 and the CAC (France 40) with rising tensions between the US and China dampening sentiment.
As market participants continue to monitor China’s response to US speaker Nancy Pelosi’s visit to Taiwan, earnings season has provided an additional catalyst for price action as investors search for additional signs of a recession.
DAX 40 Technical Analysis
With the current geopolitical environment (rising inflation, aggressive rate hikes, slowing growth and war) limiting equity gains, the German DAX 40 has remained resilient around a prominent range. With prices trading cautiously around 13,500, price action remains above the 200-week MA (moving average) while the 23.6% Fibonacci level (2011 – 2021 ATH) provides resistance at 13,620.
DAX 40 Weekly Chart
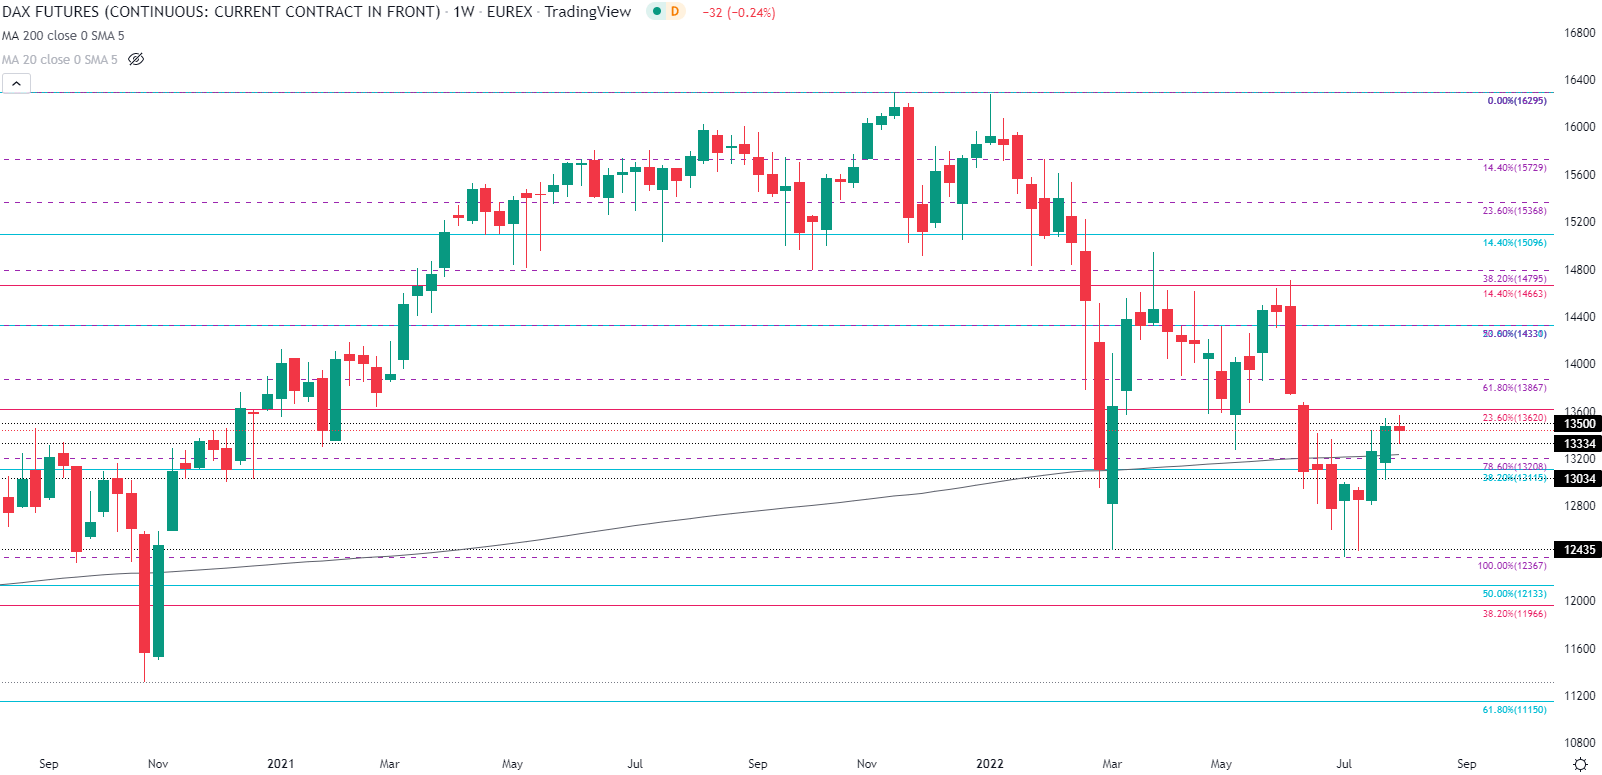
Chart prepared by Tammy Da Costa using TradingView
If bears manage to drive prices below 13,300, the 78.6 Fib could provide support at 13,208 with a move lower leaving the door open for 13,000.
DAX 40 Daily Chart
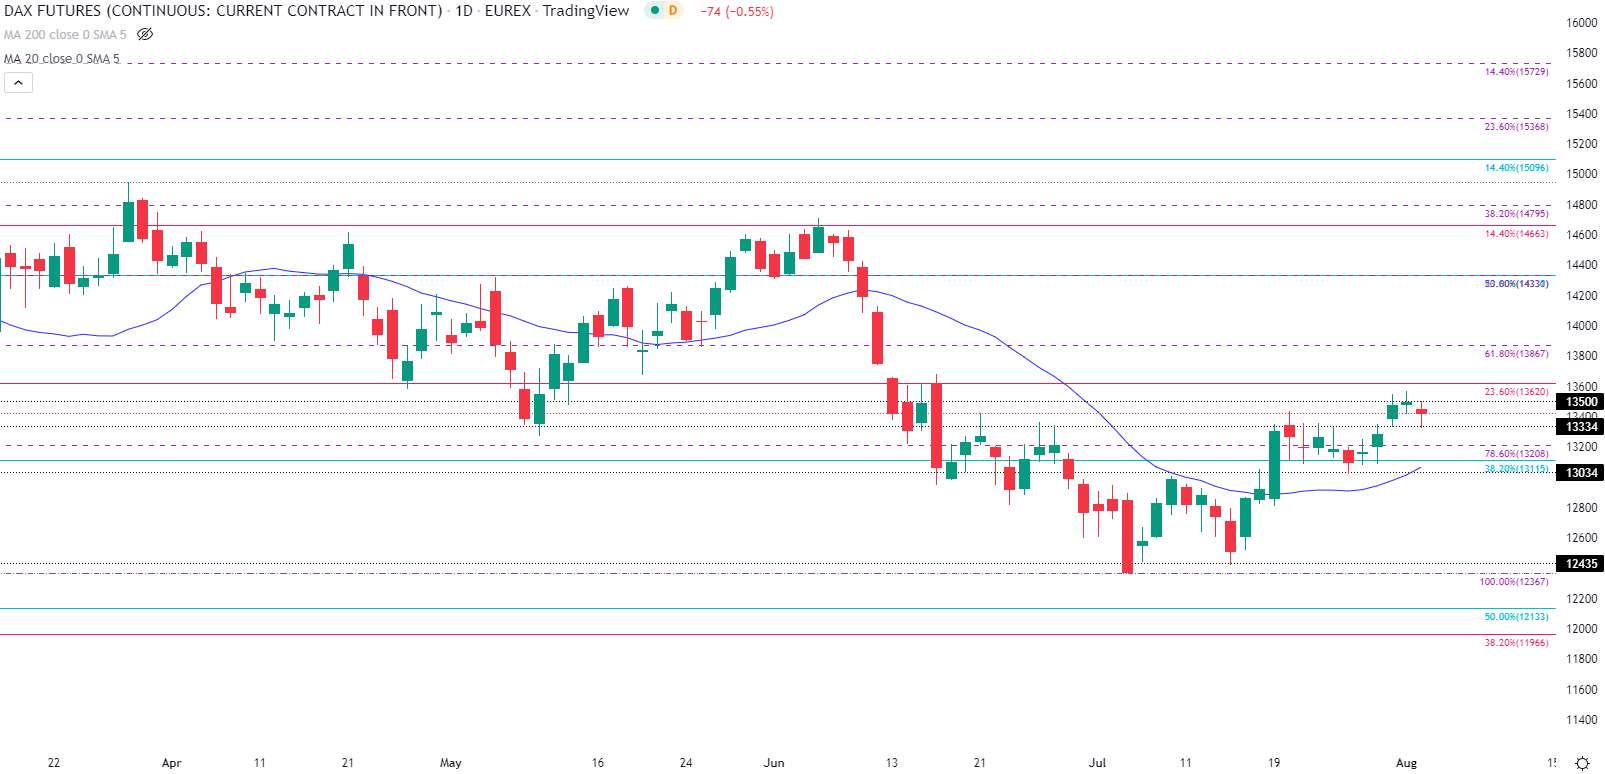
Chart prepared by Tammy Da Costa using TradingView

CAC 40 Technical Analysis
At the time of writing, the CAC 40 has fallen back towards 6,400 with the 76.4% Fib of the 2011 – 2022 move providing additional support at 6,275. If the bearish move gains traction, a break of 6,000 could provide an opportunity for a retest of the March low at 5,751.
CAC 40 Daily Chart

Chart prepared by Tammy Da Costa using TradingView
FTSE 100 Update
With positive earnings from oil giant BP supporting the FTSE 100, the energy sector rose by 1.86% while basic materials suffered the largest loss at 1.52%
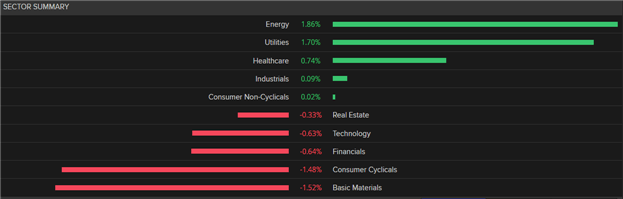
Source: Refinitiv
FTSE 100: At the time of writing, retail trader data shows 32.80% of traders are net-long with the ratio of traders short to long at 2.05 to 1. The number of traders net-long is 4.33% higher than yesterday and 12.06% lower from last week, while the number of traders net-short is 0.39% lower than yesterday and 9.45% higher from last week.
We typically take a contrarian view to crowd sentiment, and the fact traders are net-short suggests FTSE 100 prices may continue to rise.
Positioning is less net-short than yesterday but more net-short from last week. The combination of current sentiment and recent changes gives us a further mixed FTSE 100 trading bias.
| Change in | Longs | Shorts | OI |
| Daily | -31% | 16% | -1% |
| Weekly | 12% | 0% | 3% |
--- Written by Tammy Da Costa, Analyst for DailyFX.com
Contact and follow Tammy on Twitter: @Tams707


