


Crypto Talking Points:
- Bitcoin recovery stalls after two week rally
- BTC/USD enters a confluent zone between key Fibonacci levels
- USD weakness boosts demand for alternative assets

Bitcoin Rebound Muted by Technical Resistance
Bitcoin is trading with lackluster motion after failing to gain traction above $24,000. With the recent Fed rate decision driving real yields lower, risk assets rebounded from their recent slump, pushing the total crypto market cap back above $1 Trillion.
After two consecutive weeks of gains, BTC/USD rose approximately 17% in July, ending the three month losing streak that has ensued since the end of March.
At the time of writing, the daily chart below highlights two Fibonacci levels providing immediate support and resistance at $22,808 and $24,818 respectively with the 50-day MA (moving average) providing additional support at $21,302. With low-bodied candles suggestive of indecision, a break of the current range could assist in providing momentum for the next big move.
Bitcoin (BTC/USD) Daily Chart

Chart prepared by Tammy Da Costa using TradingView
With price action trading comfortably above $20,000, a rise above the 200 MA and the formation of a potential MACD crossover below the zero line (on the weekly time-frame) could be an indication that the bearish move may be running out of steam. the 23.6% Fibonacci (March – June move) remains intact with a break above bringing the $26,000 psychological level back into play.

Bitcoin (BTC/USD) Weekly Chart

Chart prepared by Tammy Da Costa using TradingView
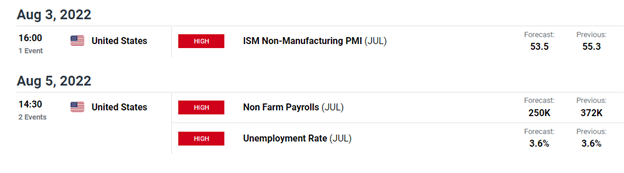
While market participants continue to price in interest rate expectations, the release of the NFP (non-farm payroll) report may provide an additional catalyst for price action as the Fed monitors the employment data for signs of a potential recession.
--- Written by Tammy Da Costa, Analyst for DailyFX.com
Contact and follow Tammy on Twitter: @Tams707


