


Gold (XAU/USD) Analysis
- Gold drops through 1800 with ease, on the verge of testing 1700
- Key technical levels for gold as the MACD hints at continued selling

Gold Drops Through 1800 with Ease, 1700 in Sight
Gold has dropped rather aggressively since breaking below the 1800 level last week. A combination of rising interest rate expectations and worsening economic data across the board has laid the foundation for golds sharp decline.
The precious metal continues the downtrend this morning after Chinese GDP printed at a meager 0.4% for the lockdown impacted Q2, down from a forecasted 1%. This has knock-on effects as China and the US have now revealed traces of economic fragility, adding to recession fears. First quarter US GDP declined by 1.6%, declining consumer sentiment and the latest rendition of the yield curve inversion (US10Y – US02Y) have added to recession concerns.
It is also worth noting that gold, often regarded as an inflation hedge, has not been rising in line with surging inflation. This is because gold’s status as an inflation hedge tends to hold up better over the long run while shorter-term influences like the state of the economy and interest rate developments continuing to influence the direction of the yellow metal for now.
Key Technical Levels for Gold (XAU/USD)
Gold’s weekly chart reveals the relative ease with which 1800 and 1760 were surpassed on the downside. The zone of support (1755 – 1765) held up gold prices for the better part of 2021 meaning the current move is certainly significant.
Interestingly enough, the momentum indicator, the MACD shows little to no let up for continued selling while the daily RSI reading moves deeper into oversold territory – hinting at a temporary consolidation before the next move lower. Therefore, 1676 appears as a potential challenge to the bearish trend. Resistance lies back at 1755 followed by 1774.
Gold (XAU/USD) Weekly Chart
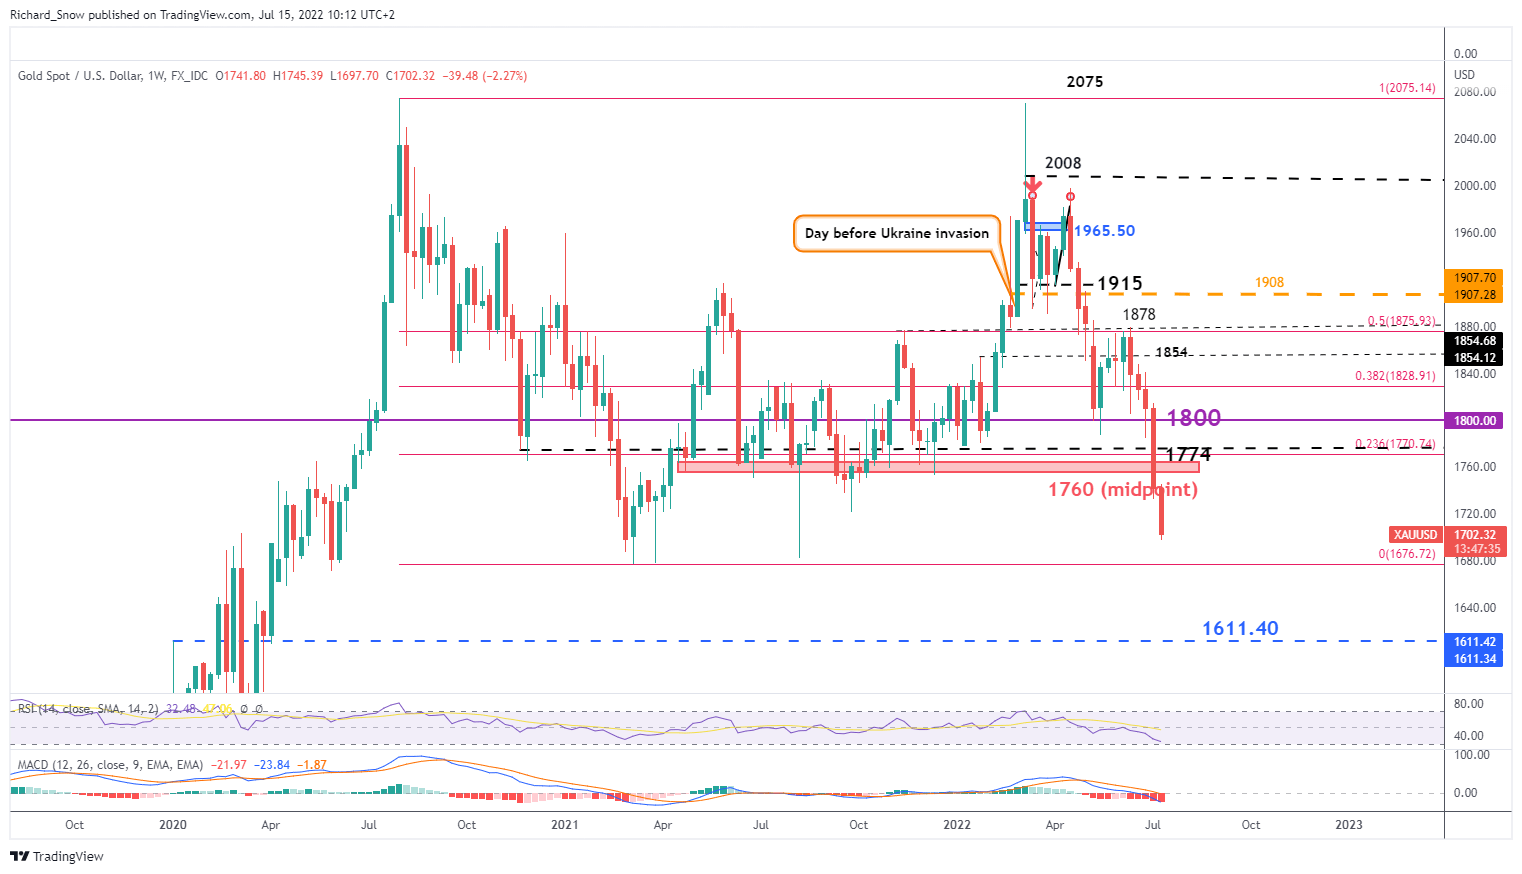
Source: TradingView, prepared by Richard Snow

How Much Further Can Gold Go?
Looking at the monthly chart, the current decline from the high (18%) is dwarfed by the 2012,2013 drop of 34% before continuing to sell off even further. For now, the major determinant of whether we are likely to see a similar decline is whether we get a conclusive breakdown of the 2021 low at 1676.72. Below 1676.72, gold has very little recent support to stop declines, which is worrying for gold bugs.
Gold (XAU/USD) Monthly Chart
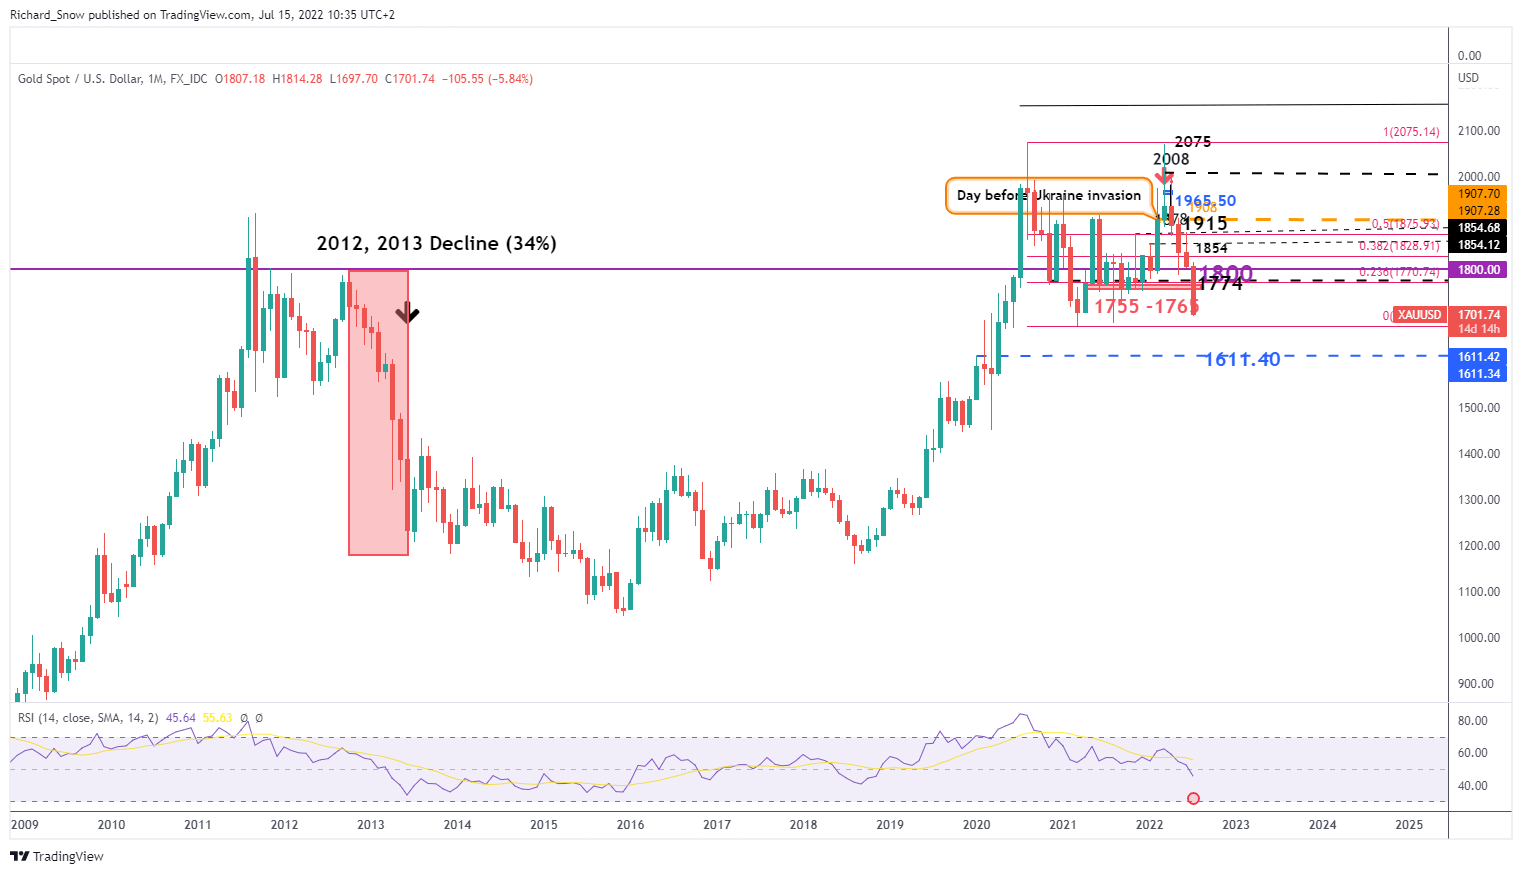
Source: TradingView, prepared by Richard Snow
Trade Smarter - Sign up for the DailyFX Newsletter
Receive timely and compelling market commentary from the DailyFX team
--- Written by Richard Snow for DailyFX.com
Contact and follow Richard on Twitter: @RichardSnowFX


