


Nasdaq 100, ASX 200, ECB, Chinese CPI, US CPI, Technical Analysis – Asia Pacific Indices Briefing
- Nasdaq 100, tech stocks sink as another central bank becomes more hawkish
- Australia’s ASX 200 vulnerable to Chinese lockdowns, slowing global growth
- Will China CPI data keep the PBOC on its toes amid stimulatory measures?

Thursday’s Wall Street Trading Session Recap
Sentiment notably deteriorated on Wall Street looking back to Thursday’s trading session. Futures tracking the Nasdaq 100, S&P 500 and Dow Jones fell 2.7%, 2.4% and 1.9% respectively. For all three of the major benchmark stock indices, this meant the worst daily performance since May 18th. With that in mind, what seemed to drive the pessimism?
You would have to go back further to the European session when the European Central Bank (ECB) announced its latest monetary policy announcement. Until recently, the ECB was seen as a relatively dovish central bank. President Christine Lagarde helped to further downplay that notion amid rising inflationary pressures.
The ECB boosted inflation expectations while downgrading growth forecasts. It also announced that it will stop purchasing assets starting in July, with plans to raise interest rates in the near term. Thus, another central bank takes a turn to the hawkish side, amplifying concerns about liquidity being drained from financial markets and pushing up bond yields, undermining risk-sensitive assets. Unsurprisingly, tech was one of the worst-performing sectors in the S&P 500 on Thursday – see chart below.
S&P 500 Sector Breakdown 6/9/2022
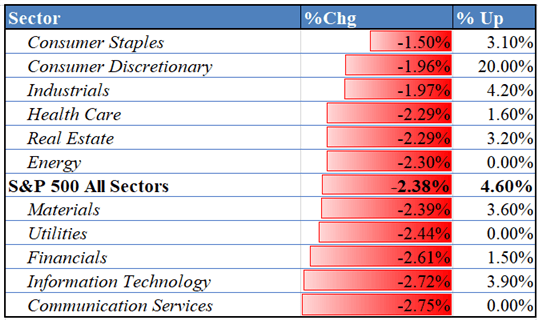
Data Source: Bloomberg
Nasdaq 100 Technical Analysis
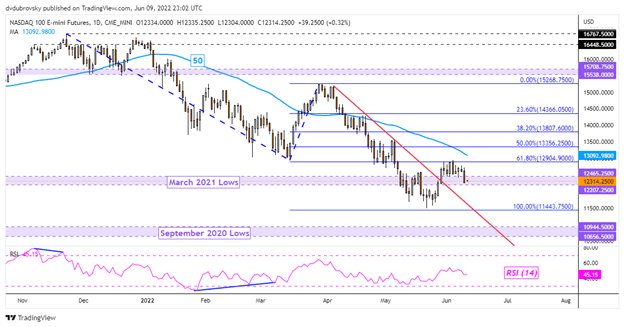
On the daily chart, the Nasdaq 100 fell under near-term support, which was sitting around 12465. That has placed the focus on the May low at 11491, which is sitting right above the 100% Fibonacci extension at 11443. Further losses over the remaining 24 hours could open the door to revisiting the bottom from last month. Otherwise, key resistance seems to be the 61.8% Fibonacci extension at 12904.
Nasdaq 100 Futures Daily Chart
Friday’s Asia Pacific Trading Session – Chinese Inflation
The quite pessimistic session on Wall Street is leaving the door open for an extension during Friday’s Asia-Pacific trading session. Australia’s ASX 200 index could be particularly vulnerable as China recently resumed locking down as part of Xi Jinping’s “Zero-Covid” policy. The world’s second-largest economy will also be releasing its latest inflationary figures.
Headline CPI is seen ticking higher to 2.2% y/y in May from 2.1% prior. Prices at the factory though are seen weakening to 6.4% y/y from 8.0%. This is leaving the PBOC in a tricky situation as the country employs a stimulatory policy. Softer outcomes could boost sentiment if that means further measures, but markets also have to contend with US CPI over the remaining 24 hours.

ASX 200 Technical Analysis
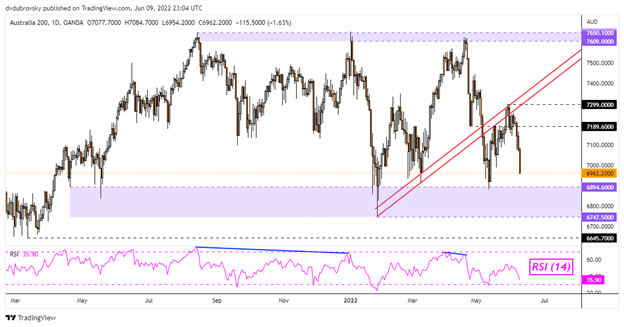
The ASX 200 has fallen over 4.6% from the May 30th high, placing the index closer to a fairly wide zone of support that has been holding for over a year. This is the 6747 – 6894 range, which could remain in play and help pivot prices higher. That would still leave the ASX in a broadly consolidative state, with resistance above at 7609 - 7650.
ASX 200 4-Hour Chart
--- Written by Daniel Dubrovsky, Strategist for DailyFX.com
To contact Daniel, use the comments section below or @ddubrovskyFX on Twitter
Trade Smarter - Sign up for the DailyFX Newsletter
Receive timely and compelling market commentary from the DailyFX team


