


EUR/USD Analysis and Talking Points
- Euro Area Inflation Hits Fresh Record Peak, Supports ECB Rate Hike Case
- EUR/USD Upside Momentum Stalling, Risk of EUR/USD Pullback

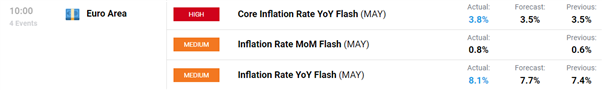
Euro Area Inflation At Fresh Record High
Euro Area inflation rose to 8.1% in May, up from 7.5% and above expectations of 7.7%. The core figure also printed above expectations at 3.8% vs 3.5% and thus reaffirms the case for ECB tightening in Q3. Although, the question for the ECB is whether the bank will go ahead with 25 or 50bps in July. Despite money markets pricing in 34bps worth of tightening in July, a 25bps hike remains the base case for me. Alongside this, slower growth remains the risk going forward, which in turn, still supports the bias to fade dips in the US Dollar.
Source: DailyFX
Corrective price action in EUR/USD has seen the pair recover towards the 38.2% Fibonacci retracement of the 2022 range. However, momentum appears to be stalling around the 1.0750-80 region, which offers Euro bears an area to look for a pullback in the currency. Keep in mind, that EU leaders agreeing to a partial oil embargo on Russia will block 2/3 of Russian oil imports, will ultimately weigh on the growth outlook for the EU going forward and by extension will pressure the Euro.
The current recovery in the Euro is around 4% from its recent lows, compared to prior recoveries of 3.3-3.5% in January and March, which signals to me that the current bounce back maybe a bit long in the tooth. While last week’s comments by Fed’s Bostic regarding a potential pause in tightening as soon as September likely exacerbated the USD weakness, the Fed will have little desire to pivot away from its aggressive tightening outlook given inflation remains very sticky at extremely elevated levels.
| Change in | Longs | Shorts | OI |
| Daily | -7% | 16% | 0% |
| Weekly | -3% | 20% | 4% |
EUR/USD Chart: Daily Time Frame
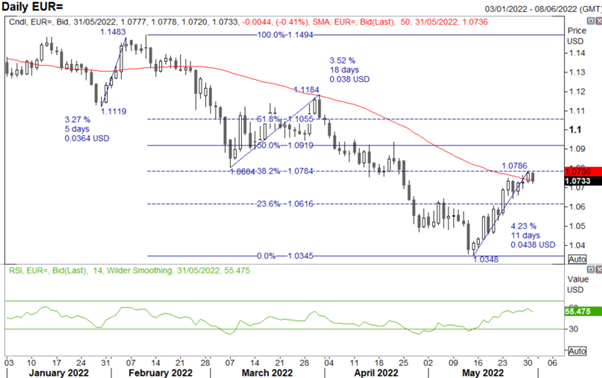
Source: Refinitiv
FINAL WORD: Month-End Rebalancing
Reminder, today is month-end and thus FX rebalancing may lead to noisy price action as we head towards the 4pm London fix. At present, investment bank models signal net USD selling.
EXPLAINER OF FX MONTH END REBALANCING
London WMR Fix (1600 London Time): The WMR Fix is one of the most widely used benchmarks for FX trading, taking place every day within a 5-minute window around 1600 London time. The fix provides a standard set of currency benchmark rates so that equity and bond investors can compare portfolio valuations and performance with each other.
The WMR fix tends to coincide with a sharp rise in trading volume, prompting a sizeable increase in liquidity. Occasionally, this allows for large real money flows to take place without causing too many distortions. However, flows can also be dominant in one direction (strong buying or strong selling) leading to outsized moves in a very short period of time.
The largest bout of volatility stems from the month-end fix, taking place on the last business day, where market extreme moves can often occur in the lead up during 15:00-16:00 London Time. These FX flows are derived from mostly equity rebalancing.
As such, if a UK portfolio manager holds US Dollar-denominated assets and seeks to hedge FX risk, then a monthly rise in the value of those assets will lead to more dollar hedging (selling the dollar). For example, if equities are FX hedged and US stocks (S&P 500) have risen on the month, while the FTSE 100 (UK stock market) has traded flat, then UK based investors would sell US Dollars against the Pound to add to their hedge, leading to an appreciation in GBP/USD. The greater the outperformance of US equity market over the UK would be associated with greater selling of the USD against GBP, prompting GBP to rise even higher. Although, extreme moves can often partially revert in the day following the month-end fix. That said, the occurrence of such event in a market as liquid as FX, suggests that the London fix (month-end fix in particular) is important for FX traders to watch for.


