


Bitcoin (BTC) Analysis
- Bitcoin is attempting to break below the descending triangle in its latest move which opens the door to a more dire technical outlook
- Key technical levels for bitcoin (BTC/USD)
Bitcoin Drops as Equity Markets Attempt to Move Higher
Bitcoin and the major US stock markets, particularly the S&P 500 and the Nasdaq 100, have tended to move in the same direction and are both seen as ‘risky’ assets. Both markets topped ahead of the global monetary tightening cycle and have moved considerably lower since the respective highs.
Despite briefly entering a technical bear market (dropping 20% from the high), the S&P 500 is on track to mark two days of gains and is up around 4.5% from the recent lows, bitcoin however, has witnessed price action consolidating around 28,800 and 30,500 zone.
The largest cryptocurrency by market cap was trading within a descending triangle which has come under threat today as we have seen an attempt to trade below the formation. This pattern, which is typically bearish, indicates that sellers are more aggressive than buyers as price continues to make lower highs, while the lows are generally contained until sellers muster enough force to overpower bulls.

The recent break below the underside of the triangle at 28,630 brings the recent spike low of 26,590 into focus. In the event of continued bearish momentum, things could get very ugly for bitcoin very fast.
If we are to see a move higher form here, the first test appears via the 31,500 level followed by 32,940.
Bitcoin Daily Chart
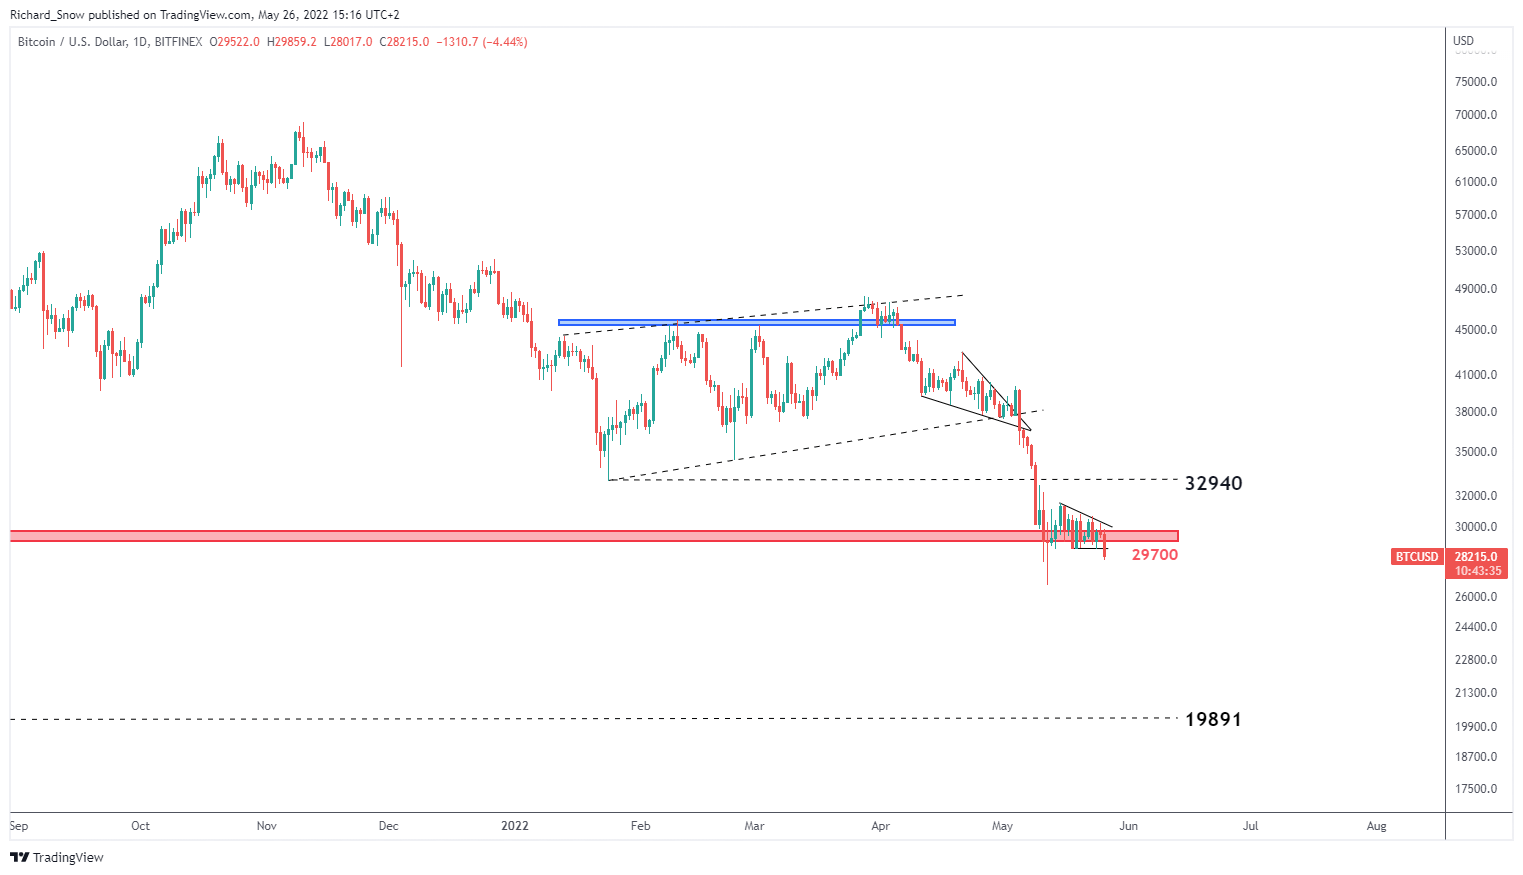
Source: TradingView, prepared by Richard Snow
The reason I say things can get very bad for bitcoin is due to the nature of the crypto market when momentum picks up. Throughout its short history bitcoin has surged by staggering amounts in short periods of time but has also tanked and halved its value, or worse, in next to no time. The most recent surge witnessed a 400% rise in just over a year and because of that there is little traction to be had if we are to see a massive drop in the crypto.
Zooming out on the daily chart you can see a bit of consolidation between 23,800 and 22,700 but after that, the next significant level appears as far as 19,891. The crypto market is still reeling from the Terra (LUNA) and the stablecoin’s recent de-pegging from the dollar.
Bitcoin Weekly Chart
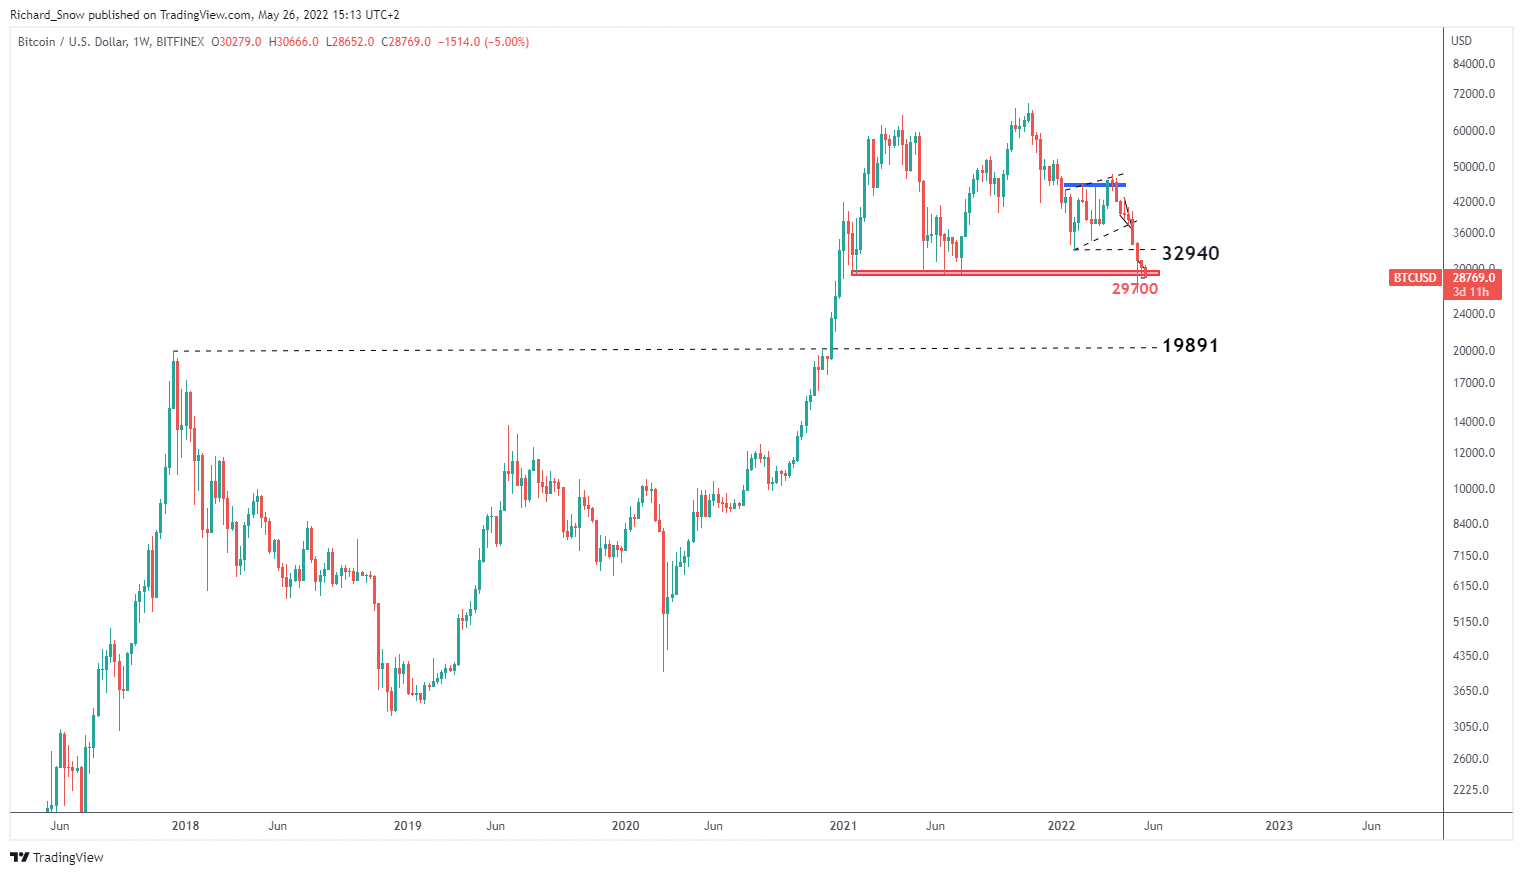
Source: TradingView, prepared by Richard Snow
Trade Smarter - Sign up for the DailyFX Newsletter
Receive timely and compelling market commentary from the DailyFX team
--- Written by Richard Snow for DailyFX.com
Contact and follow Richard on Twitter: @RichardSnowFX


