


S&P 500, Nasdaq 100 Prices, Charts, and Analysis
- S&P 500 remains heavy ahead of US NFPs.
- Nasdaq 100 is a short distance away from a fresh one-year low.

The US stock markets gave back all of Wednesday’s post-FOMC rally and more on Thursday as sellers wiped the floor with the market. The Nasdaq 100 fell by 5%, the S&P 500 shed 3.5% while the Dow Jones lost 3.12%. Losses were indiscriminate with no sector spared from the selling as investors’ concern over the growth outlook in the US dominates market trade.
Trade Smarter - Sign up for the DailyFX Newsletter
Receive timely and compelling market commentary from the DailyFX team
The monthly US Jobs Report (NFP) is released at 12:30 UK today with the market looking for 391k new jobs created in April compared to 431k in the prior month. The unemployment rate is seen ticking marginally lower to 3.5%, while month-on-month average hourly earnings look set to remain unchanged at 0.4%. The US jobs market remains robust and unless today’s report disappoints, the US dollar should remain bid as traders continue to factor in higher US interest rates. The Fed’s John Williams and Raphael Bostic both speak later today and they may give a bit more insight into Wednesday’s FOMC decision.
For all market-moving data releases and events, see the DailyFX Economic Calendar
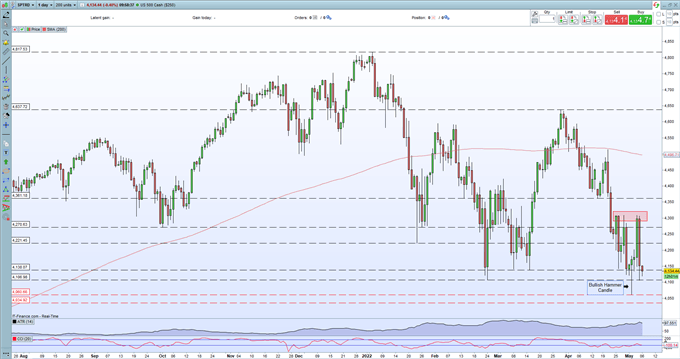
The S&P 500 chart shows how technical analysis can work even in times of turmoil. The bullish hammer candle we identified on Monday produced a sharp rebound until yesterday’s sell-off, while the zone of resistance we looked at around 4,300 – 4,310 held on Wednesday and Thursday. For the S&P to have any chance of recovering in the short term then 4,060 needs to hold otherwise 4,035 will come into play fairly quickly. The 4,300 – 4,310 resistance zone should hold any attempts to push higher. Volatility remains at a multi-week high.
S&P 500 Daily Price Chart – May 6, 2022
Retail trader data show 68.09% of traders are net-long with the ratio of traders long to short at 2.13 to 1. The number of traders net-long is 18.01% higher than yesterday and 16.33% higher from last week, while the number of traders net-short is 26.33% lower than yesterday and 14.60% lower from last week.
We typically take a contrarian view to crowd sentiment, and the fact traders are net-long suggests US 500 prices may continue to fall. Traders are further net-long than yesterday and last week, and the combination of current sentiment and recent changes gives us a stronger US 500-bearish contrarian trading bias.
| Change in | Longs | Shorts | OI |
| Daily | -5% | 0% | -3% |
| Weekly | 23% | -14% | 1% |
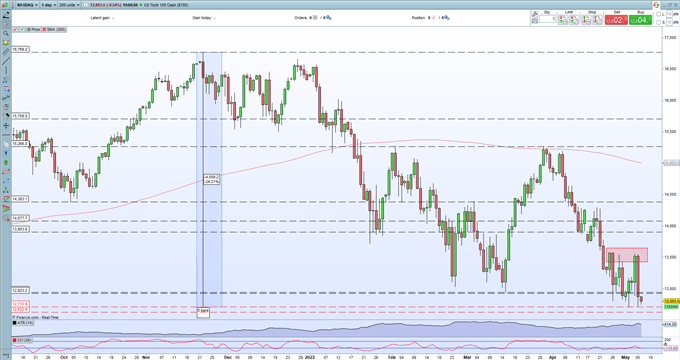
The Nasdaq 100 is back in bear market territory and has lost around 25% of its value since the November 22 peak at 16,770. A similar chart pattern to the S&P 500 shows a strong resistance zone around 13,500 to 13,580 and this is unlikely to be breached in the short-term. The 12,710 multi-month low is back under pressure with a confirmed break leaving 12,623 vulnerable.
Nasdaq 100 Daily Price Chart – May 6, 2022
What is your view on the US Equity Markets – bullish or bearish?? You can let us know via the form at the end of this piece or you can contact the author via Twitter @nickcawley1.


