


Federal Reserve, FOMC Talking Points:
- The Federal Reserve has announced their rate decision for the month of May, hiking rates by 50 basis points.
- This is the first 50 basis point hike since the last such move 22 years ago, in the year 2000 as the Federal Reserve tried to cool the excess of the dot com bubble. That, perhaps, worked a little too well as the dot com bust later that summer.
- This is a 'live article,' meaning that it will be updated through the rate decision and press conference. Each update is denoted with a time stamp from the time of update, and below will read in reverse chronological order.
- The analysis contained in article relies on price action and chart formations. To learn more about price action or chart patterns, check out our DailyFX Education section.

3:30 PM ET
The press conference is now over and the aftermath here is something of note. The big takeaway here is the role of expectations. The Fed hiked by 50 basis points for the first time since 2002. But, there was fear coming into the rate decision that next month, in June, may bring 75 basis points of hikes. Today – Powell confirmed that the bank’s thinking is 50 basis point hikes for the next few months, and the simple fact of coming inside of the expectation for 75 next month provided a bit of relief to both equities and the US Dollar.
This produced a massive rally in equities and the S&P 500 is now 3% off of the low that was hit at the start of the presser at 2:30 PM ET. The next level of resistance in the S&P 500 is a big spot at 4304, which has caught two recent inflections.
S&P 500 Four-Hour Price Chart
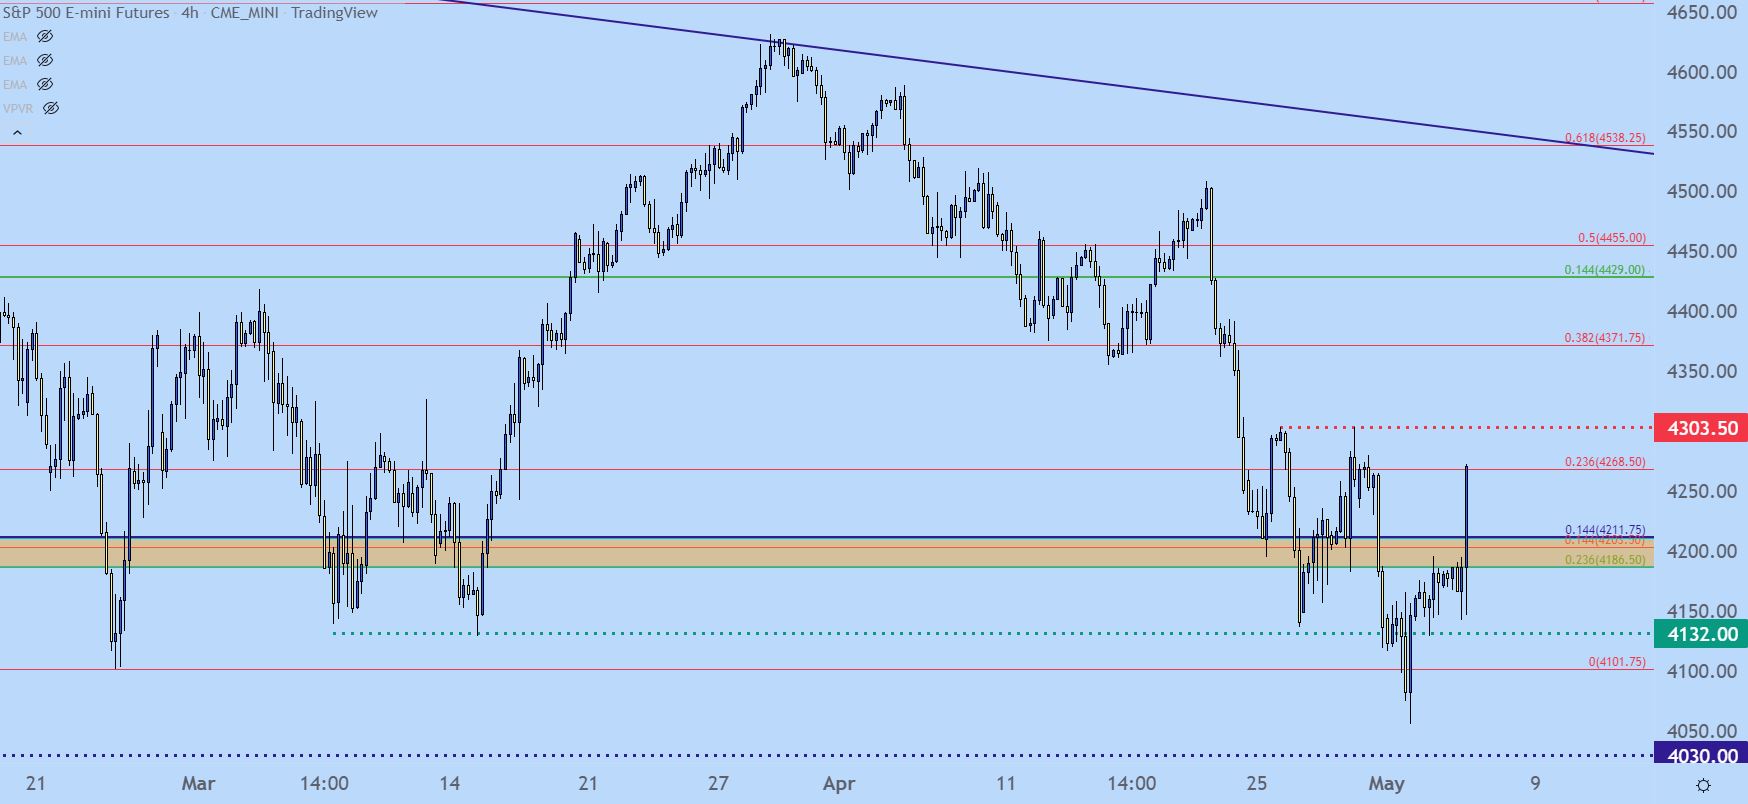
Chart prepared by James Stanley; S&P 500 on Tradingview
The Nasdaq 100 has also seen quite the run, with a 4.5% jump from the session lows at the Fibonacci level plotted at 12,895.
Nasdaq 100 30 Minute Price Chart

Chart prepared by James Stanley; Nasdaq 100 on Tradingview
And, on the currencies side of the equation, the US Dollar sank to fresh lows as Powell removed a bit of pressure from the matter.
Given how strongly bid the USD was ahead of today’s event, the big question remains for how much longer might this fall. Even the Fed’s ‘softer’ framework for rate hikes still exceeds that of counterparts in Europe or Japan, so this may be a situation where those other currencies find difficulty substantiating any long-term run, at least until something changes on that front.
Support potential in USD remains around the 102.36 Fibonacci level, and around the 102.00 level in DXY.
US Dollar Two-Hour Price Chart
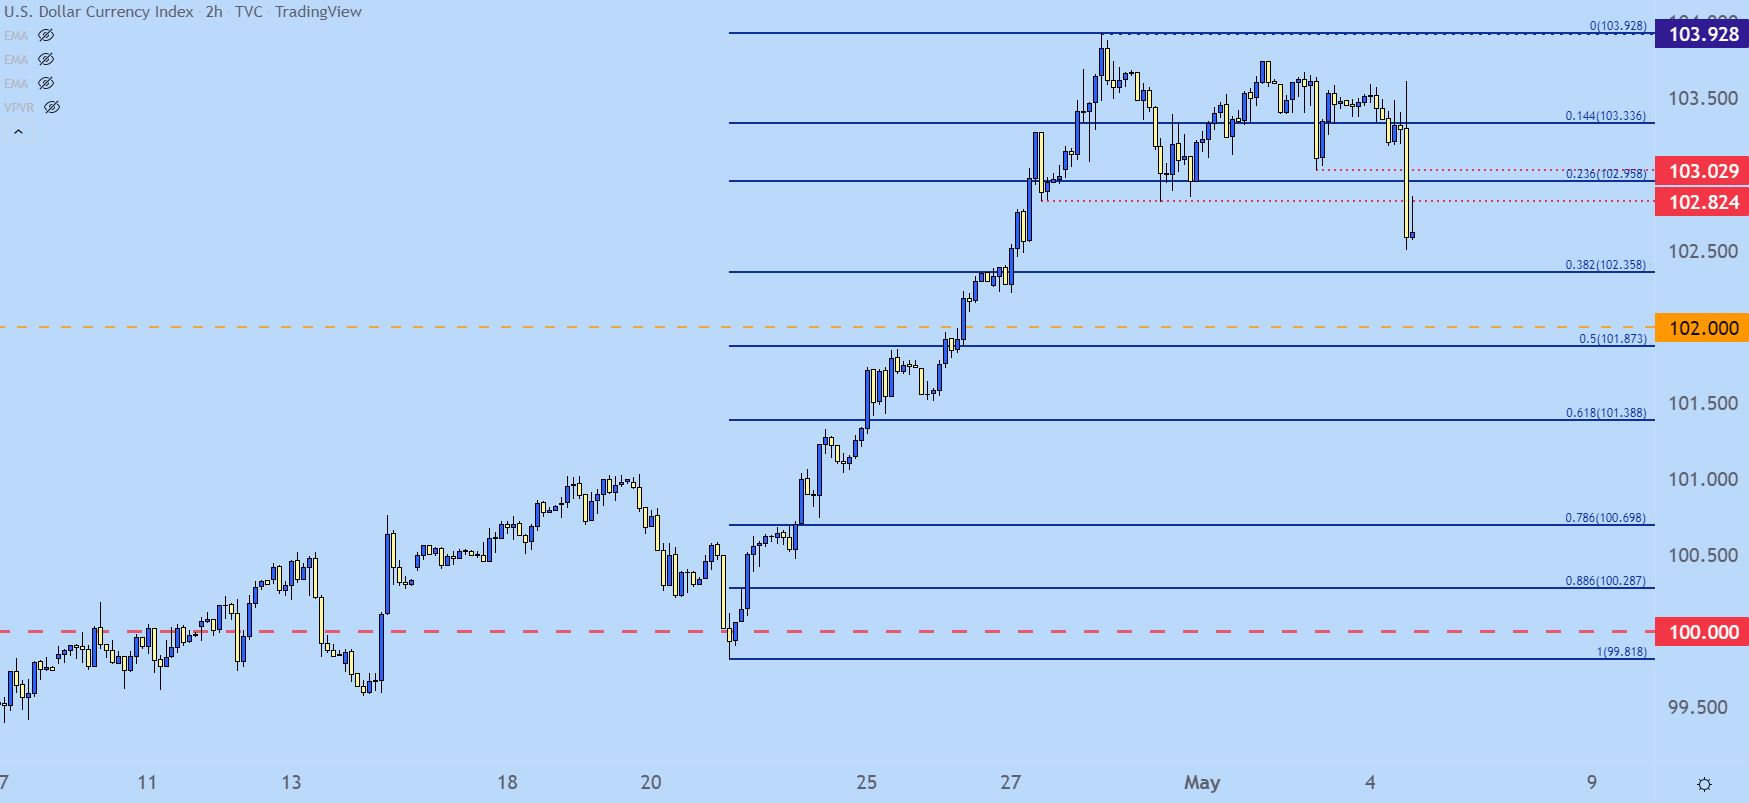
Chart prepared by James Stanley; USD, DXY on Tradingview
3:00 PM ET
The US Dollar is finally pulling back as Powell hasn’t been as hawkish as many had feared coming into today’s rate hike. The Greenback is now trading at a fresh weekly low, taking out a key spot of prior support around the 102.82 level.
US Dollar 30 Minute Price Chart
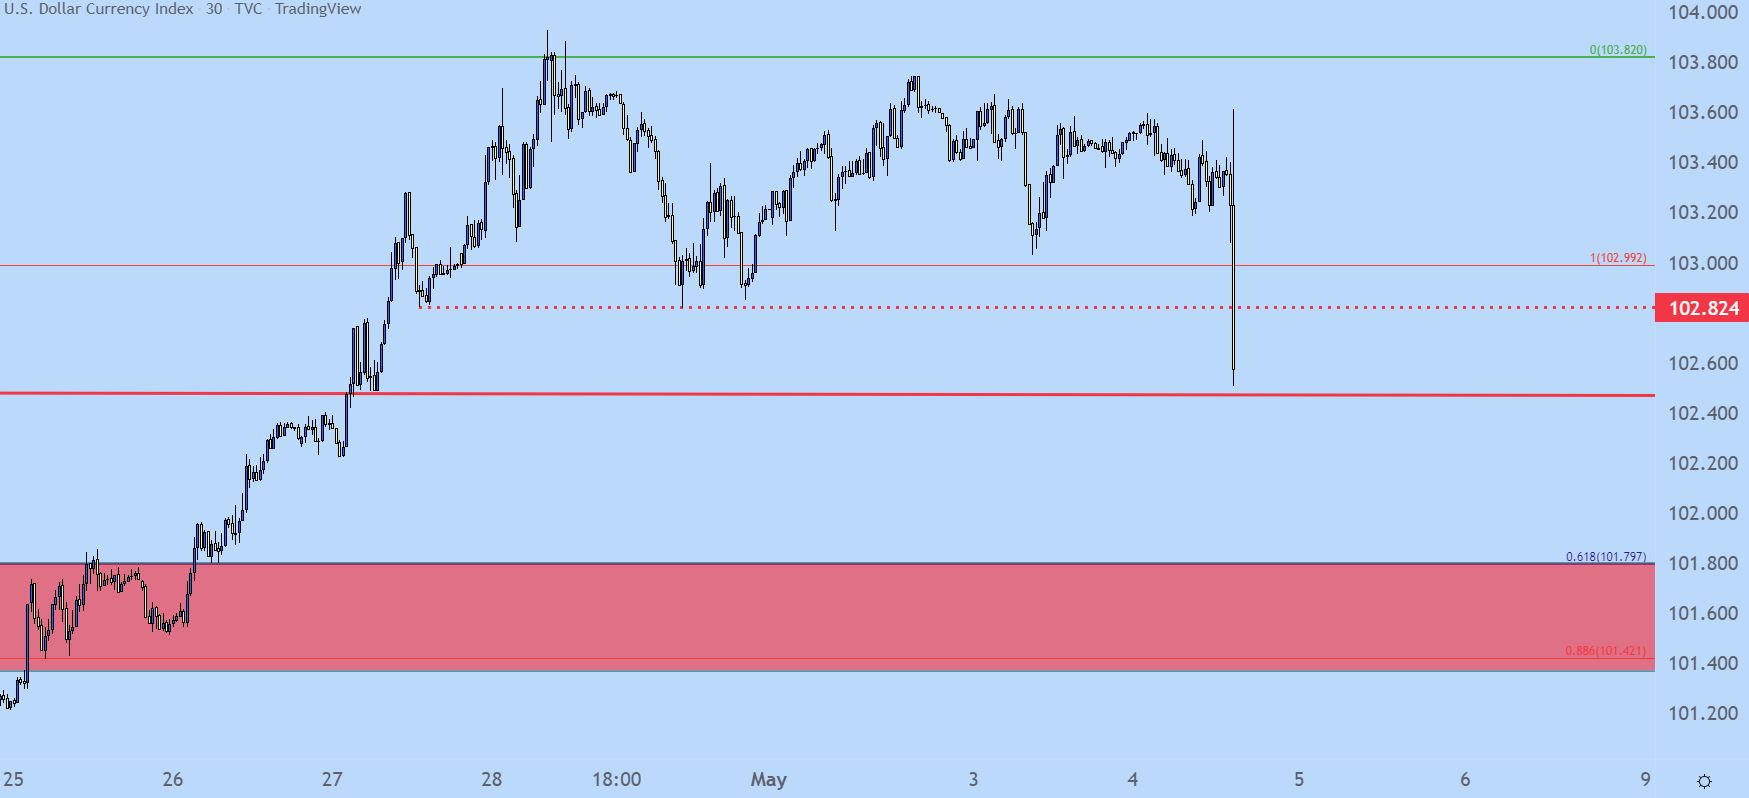
Chart prepared by James Stanley; USD, DXY on Tradingview
2:46 PM ET
More lift for stocks after Powell said that 75 basis points was not a consideration for the Fed and, instead, the bank was looking at 25 basis point hikes for upcoming meetings.
The S&P 500 has since jumped to highs of the session, highlighting the importance of expectations.
S&P 500 30 minute price chart
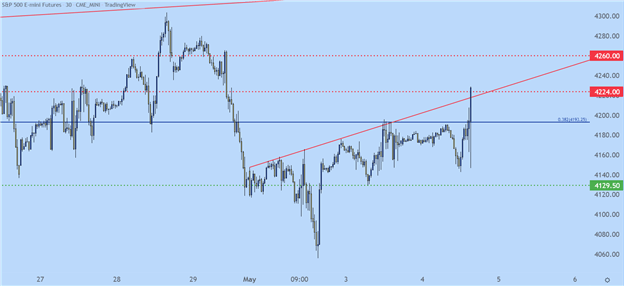
Chart prepared by James Stanley; S&P 500 on Tradingview
2:42 PM ET
Powell said that 50 basis point hikes were on the table for the next few meetings which could be a sense of relief to equity market participants, as there had been a build of expectations for 75 basis points of hikes at the June rate decision.
Stocks are getting a lift after that comment and the S&P 500 has retraced a chunk of the drop from earlier in the press conference.
S&P 500 30 Minute Chart

Chart prepared by James Stanley; S&P 500 on Tradingview
2:35 PM ET
Powell is starting the presser with a very hawkish tone towards inflation, saying that it’s ‘much too high.’ This prodded an immediate reversal in stocks with the S&P 500 now heading towards session lows.
S&P 500 30-Minute Chart
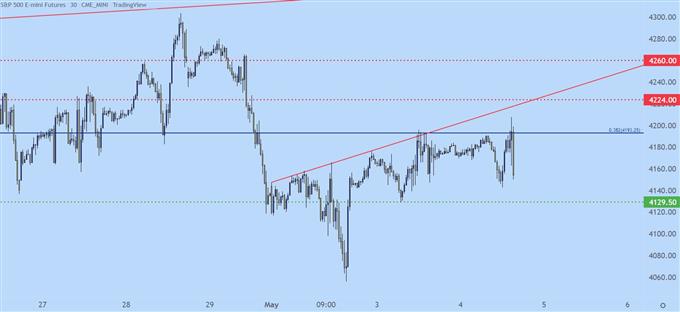
Chart prepared by James Stanley; S&P 500 on Tradingview
2:05 PM ET
The rate decision has been released and the Fed has hiked by 50 for the first time since May of 2000. This was 22 years ago and, at the time, air was still in the sails of the tech boom. That rate hike in May of 2000 was the second such move that year as March had also seen a 50 basis point hike.
If it seemed like the Fed was trying to play catch up there, it might sound somewhat similar to today, which marks the first of what’s expected to be many more 50 basis point rate hikes.
The bigger driver for today, at least in my opinion, will emanate from the press conference at 2:30 PM ET. The initial response in equities was strength as the Nasdaq pushed up to a fresh three-day-high before seeing a bit of selling, and finding support around a familiar Fibonacci level of 13,050.
Nasdaq 100

Chart prepared by James Stanley; Nasdaq 100 on Tradingview
The US Dollar has similarly pulled back but, notably, support has so far held above the 103.03 inflection point from yesterday which currently marks the weekly low. And there’s another spot of support a little lower, around 102.82.
US Dollar 30 Minute Price Chart
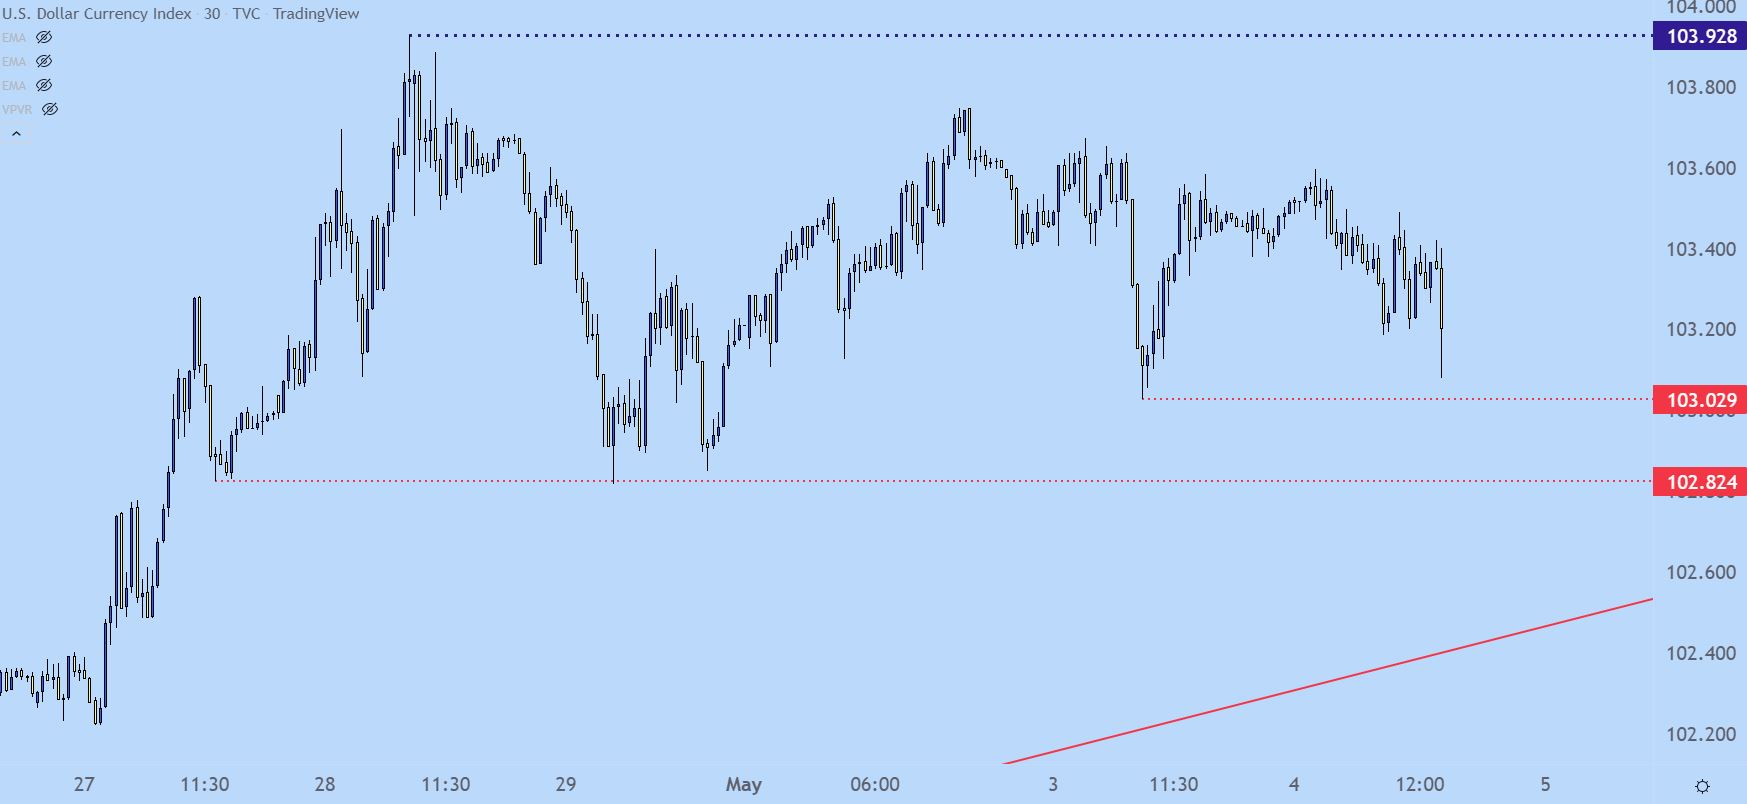
Chart prepared by James Stanley; USD, DXY on Tradingview
2:00 PM ET
We’re finally here. While the March FOMC rate decision brought lift-off after an unprecedented stimulus outlay through the Coronavirus pandemic, this rate decision is the first in which the bank is expected to hike by 50 basis points. There’s also an expectation for some information on how the bank is looking to address QT in the coming months as the Fed begins to un-do some of the accommodation that was built in around the pandemic.
This is a ‘live article’ meaning that it’ll be updated through the event. The statement with the formal announcement hits at 2PM ET. But, the press conference begins at 2:30 PM ET and, arguably, this is the more important component of today’s meeting. This is where Chair Powell can begin to gird the runway for the June rate decision in which the bank is expected to keep up their hawkish pace. As of this writing, 15 minutes before the May rate decision, markets are expecting the June rate decision to carry another 75 basis points of tightening.
Before the fireworks, the Nasdaq 100 is holding a critical spot of support around the 13k level. This is a zone of support around yearly lows that’s been in-play over the past couple weeks. And, this zone is largely in-play due to anticipation from today’s event; and not just the rate hike but what else the Fed has to say for the rest of the year.
Nasdaq 100 Daily Price Chart
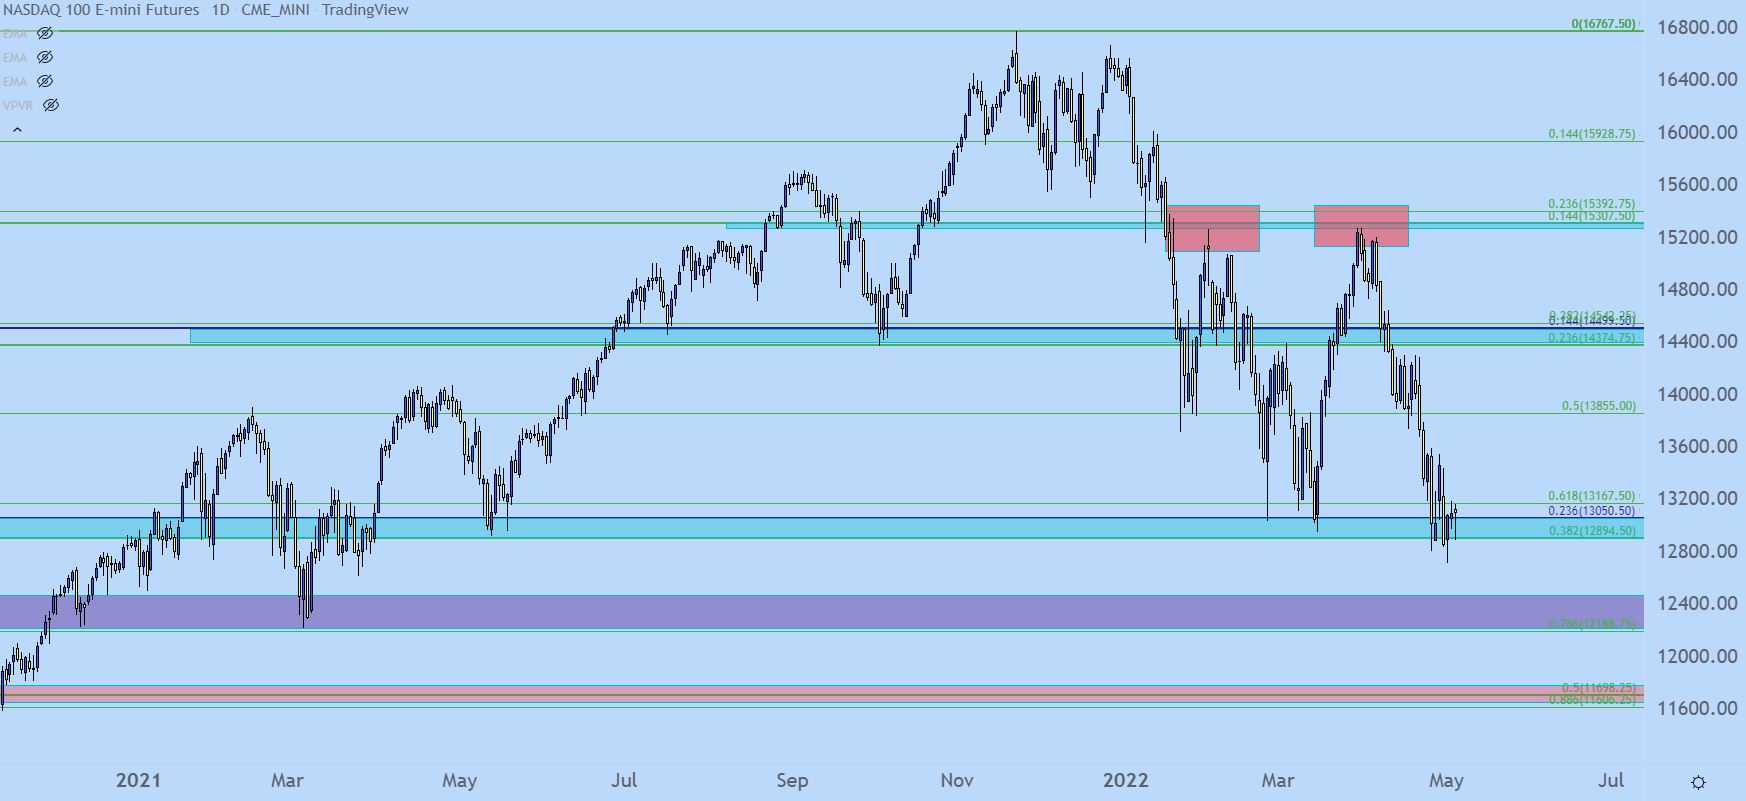
Chart prepared by James Stanley; Nasdaq 100 on Tradingview
--- Written by James Stanley, Senior Strategist for DailyFX.com
Contact and follow James on Twitter: @JStanleyFX


