DAX, CAC, FTSE Oulook:
- DAX 40 fail to clear resistance, bears retest 14,000
- CAC 40 opens in the red despite Macron victory
- FTSE 100 provides a glim outlook for bulls


German Dax Index Humbled by Rising Geopolitical Risks
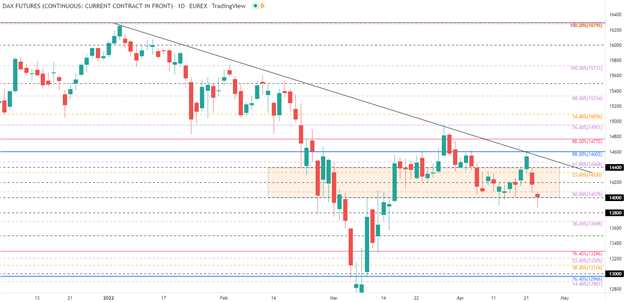
European equities have turned lower with the Dax 40 Index currently testing the critical 14,000 mark. As discussed last week, a break above 14,400 allowed bulls to temporarily drive price action higher before running into the next big level of resistance at 14,602, the 88% Fibonacci of the historical move (2003 – 2021).
However, failure to gain traction above this level enabled bears to increase selling pressure, driving prices back towards the key psychological level of 14,000 which continues to provide both support and resistance for the imminent move.
For the downward trajectory to remain intact, the German Dax would need to fall below 13,800 with additional layers of support holding at13,688 (the 32% Fib of the Feb – March move) and 13,500 respectively. A break below 13,500 may then increase the probability for bearish continuation to prevail, paving the way for a potential retest of 13,296 (the 76.4% retracement of the 2009 – 2021 move).
Dax 40 Daily Chart

Chart prepared by Tammy Da Costa using TradingView
On the contrary, for the recovery to resume, the Index would need to rise above 14,200 and 14,400 which opens the door for the 14,602 zone discussed above.


French Stocks Shrug Off Marcon Win – CAC 40 Falls
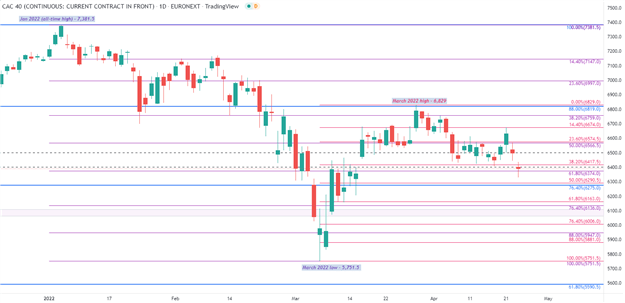
Following the reelection of French President Emmanuel Macron this weekend, the French CAC 40 Index relinquished recent gains as risk sentiment soured, driving stocks lower. After ending the week just short 6,500, French stocks gapped lower, forcing the Index to open the week at 6,400. As price action clings to psychological support, the combination of heightened volatility and risk aversion will likely continue to provide an addition catalyst for price action throughout the week.
From a technical standpoint, Fibonacci levels from both historical (2011 – 2022) and shorter-term moves have often formed zones of confluency which have held both bulls at bays. For bulls to regain control, prices would need to clear 6,400 and 6,574 (the 14.4% Fib of the March 2022 move) with the next big level at 6,700.
CAC 40 Daily Chart

Chart prepared by Tammy Da Costa using TradingView
On the downside, a break of today’s low at 6,330 and below 6,275 (the 76.4% Fib of the historical move) would then bring the next big level of support (which has provided firm levels of resistance in 2007, 2020 and 2021) residing at around 6,110.
FTSE 100 Runs Out of Gas
Much like its European counterparts, the UK FTSE 100 continued to slide after falling from the 7,600 on Friday. As discussed by Richard Snow earlier today, disappointing UK retail sales data has amplified fears over a pessimistic outlook, driving the index lower.
With prices currently trading slightly below 7,400, sellers now need to drive bearish momentum through 7,220 with the next level of support at 7,131 (the 38.2% Fib of the Feb – March move).
| Change in | Longs | Shorts | OI |
| Daily | -25% | 12% | -1% |
| Weekly | 29% | -12% | -4% |
FTSE 100: Retail trader data shows 50.24% of traders are net-long with the ratio of traders long to short at 1.01 to 1. In fact, traders have remained net-long since Mar 17 when FTSE 100 traded near 7,381.50, price has moved 0.14% lower since then. The number of traders net-long is 46.37% higher than yesterday and 128.55% higher from last week, while the number of traders net-short is 10.86% lower than yesterday and 44.16% lower from last week.
We typically take a contrarian view to crowd sentiment, and the fact traders are net-long suggests FTSE 100 prices may continue to fall.
Our data shows traders are now net-long FTSE 100 for the first time since Mar 17, 2022 when FTSE 100 traded near 7,381.50. Traders are further net-long than yesterday and last week, and the combination of current sentiment and recent changes gives us a stronger FTSE 100-bearish contrarian trading bias.
Trade Smarter - Sign up for the DailyFX Newsletter
Receive timely and compelling market commentary from the DailyFX team
--- Written by Tammy Da Costa, Analyst for DailyFX.com
Contact and follow Tammy on Twitter: @Tams707


