


US Dollar (DXY) Daily Price and Analysis
- US dollar basket (DXY) within touching distance of 100.
- The 10-year US Treasury yield nears 2.70%.

The US dollar continues to appreciate across the board with the greenback’s strength sending many US dollar pairs to near multi-month and multi-year highs. USD/JPY is within a point of levels last seen in August 2015, GBP/USD continues to test 1.3000, a level that guards lows last seen in November 2020, while EUR/USD is less than 70 pips away from lows last seen in May 2020. With the Federal Reserve looking to raise interest rates by a further 225+ basis points in 2022, according to market pricing, and with other central banks playing catch up in the fight against inflation, the US dollar looks set to appreciate further over the coming months.
The US Treasury market continues to price-in additional US rate hikes with the interest-rate sensitive UST 2-year now trading with a yield of 2.52%, up from 0.15% in June 2021, while the benchmark UST 10-year is offered with a yield of 2.68%, a level last seen in early 2019. These yields will continue to prop up the US dollar in the months ahead.
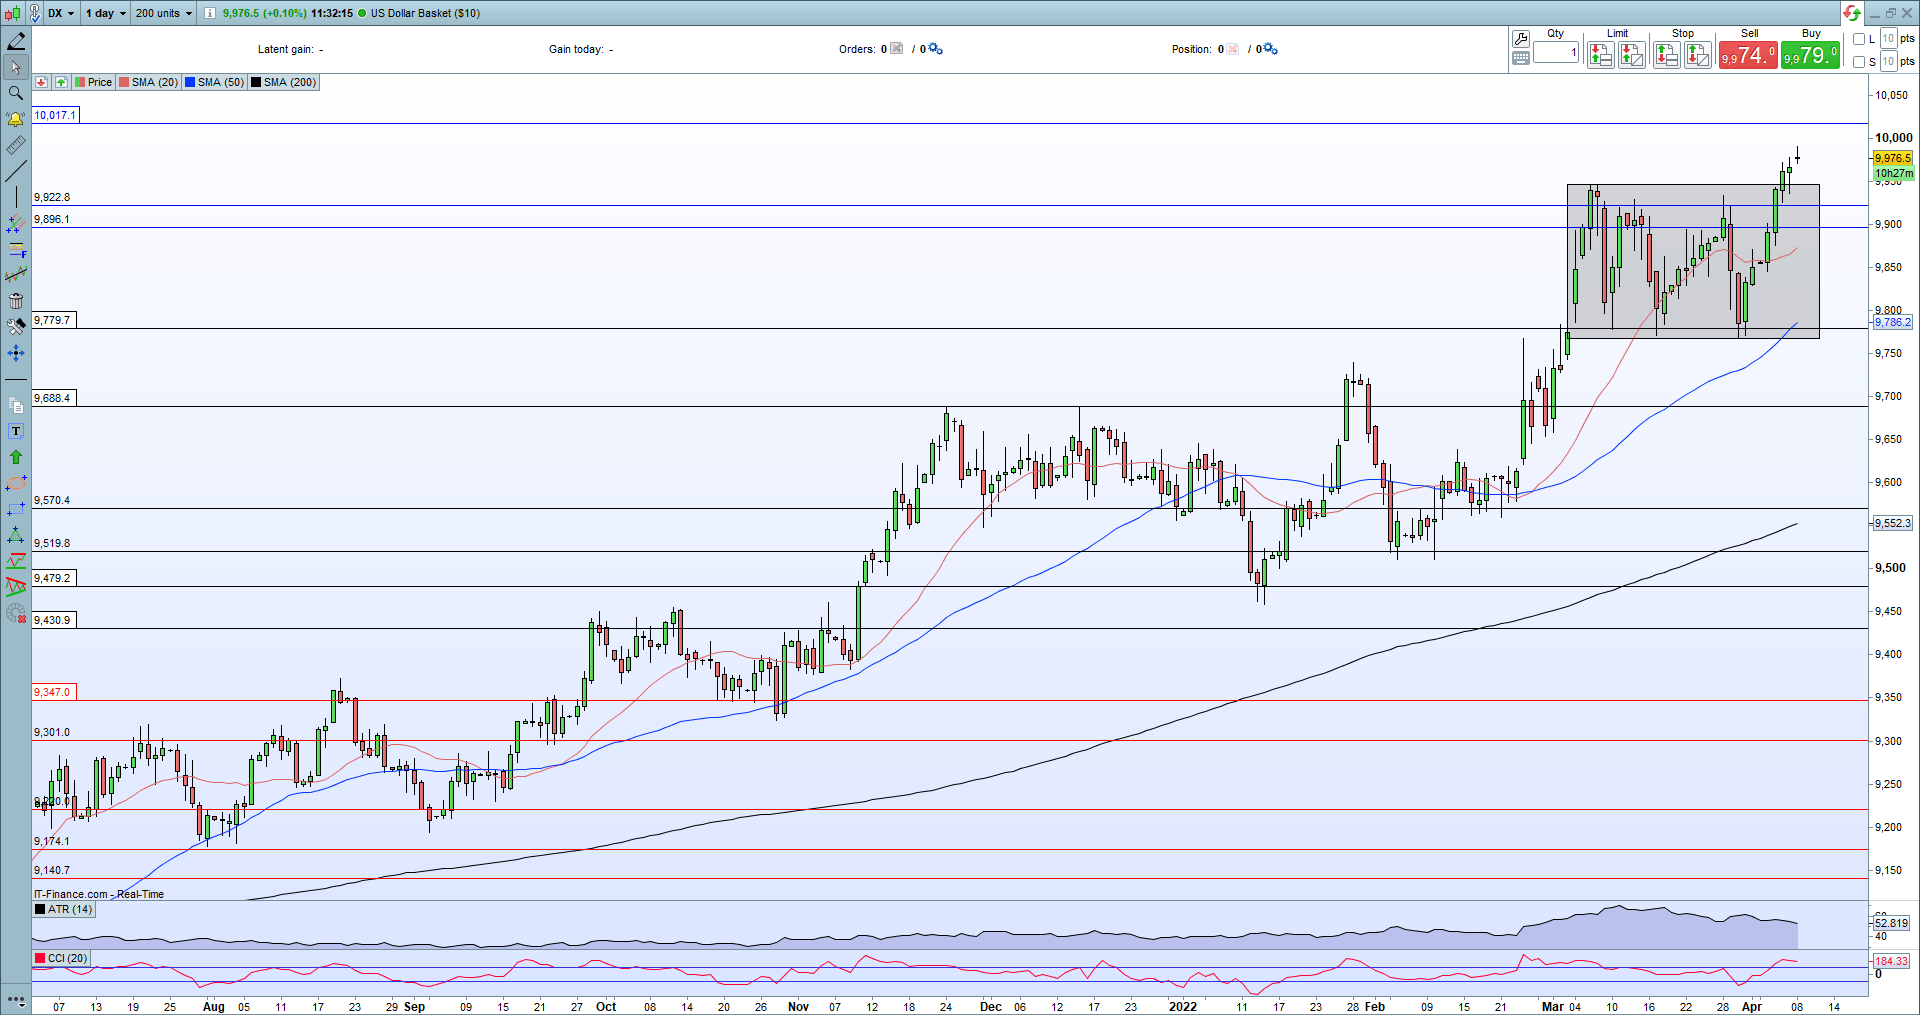
The daily US dollar basket (DXY) chart now shows the greenback breaking out of a consolidation range that has capped the upside for the last month. Today’s open above the range confirms this bullish sentiment and a close above the prior high will give the move additional credibility. The dollar basket trades above all three simple moving averages, reinforcing the push higher and the 20-dma offers additional support in the event of any short-term sell-off.
US Dollar Daily Price Chart April 8, 2022
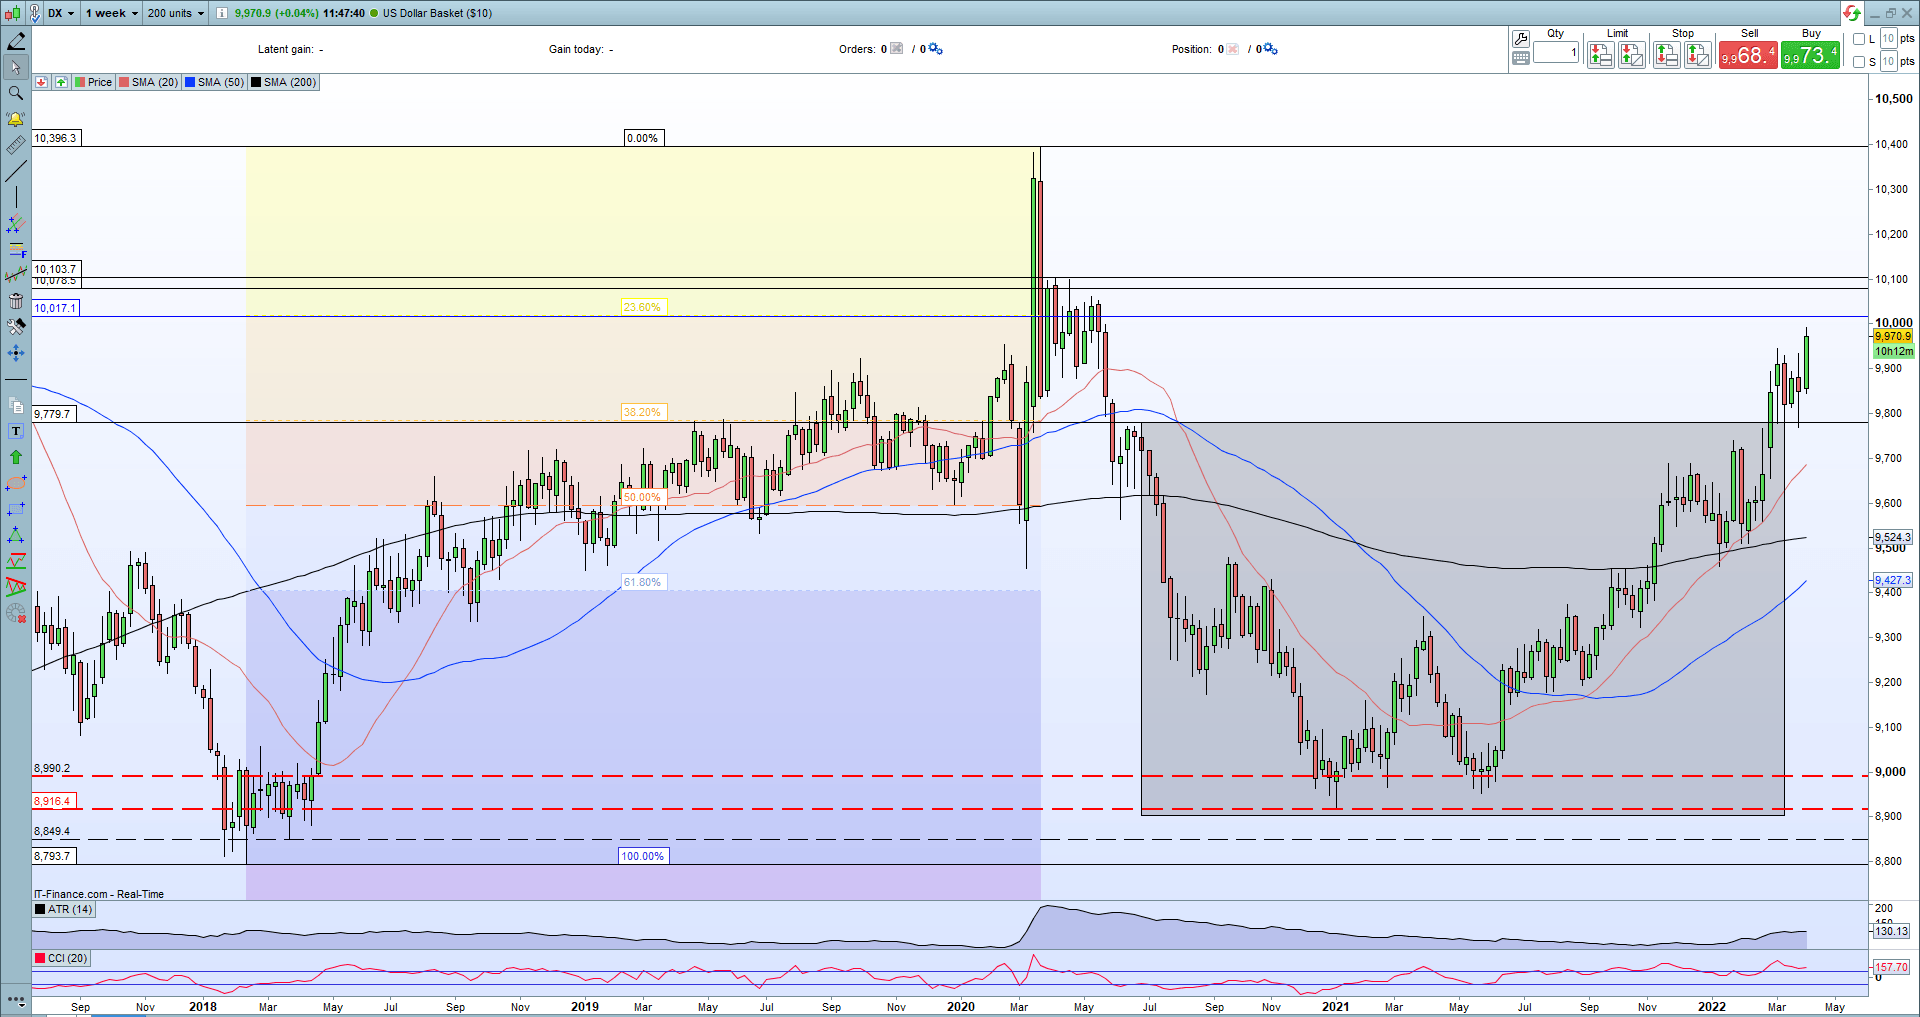
The weekly DXY chart shows that a bullish cup and handle pattern formed before the next leg higher started two months ago. The small zone just above 101.07 looks set to provide resistance before a potentially larger move to just under 104.00. This may be a move too far with the Fed’s hawkish policy already priced into the market, but any sign that the Fed is losing its battle against inflation may add further impetus back to this level.
Trade Smarter - Sign up for the DailyFX Newsletter
Receive timely and compelling market commentary from the DailyFX team
US Dollar Weekly Price Chart April 8, 2022
What is your view on the US Dollar – bullish or bearish?? You can let us know via the form at the end of this piece or you can contact the author via Twitter @nickcawley1.


