


FTSE 100 News and Analysis
- FTSE 100 fails to break critical resistance at the key psychological level of 7,500
- Formation of a hanging man candle poses a threat for bullish continuation
- Stocks remain supported, ‘risk-on’ sentiment limits losses

As discussed in yesterday’s analysis, FTSE, DAX and other global indices have recently experienced a strong rebound off of the March lows as the return of ‘risk-on’ sentiment boosted the demand for stocks.
Following an approximate 13.3% decline in the UK 100 Index from the February high, a rebound off of the 6,800 handle allowed bulls to drive prices back above the 7,000 mark before running into a wall of resistance at the key psychological level of 7,500.

Despite heightened volatility and the unprecedented geopolitical backdrop, the strong rally in UK stocks allowed the FTSE to recover around 10.8% of those losses, driving prices back to levels last tested before the invasion of Ukraine.
After five consecutive days of gains, the formation of a hanging man candle on the daily time-frame (a bullish reversal pattern that occurs after a strong uptrend and is indicative of a pause in the uptrend) forced price action back into a confluent zone, just below the 7,500 level mentioned above.
FTSE 100 Daily Chart
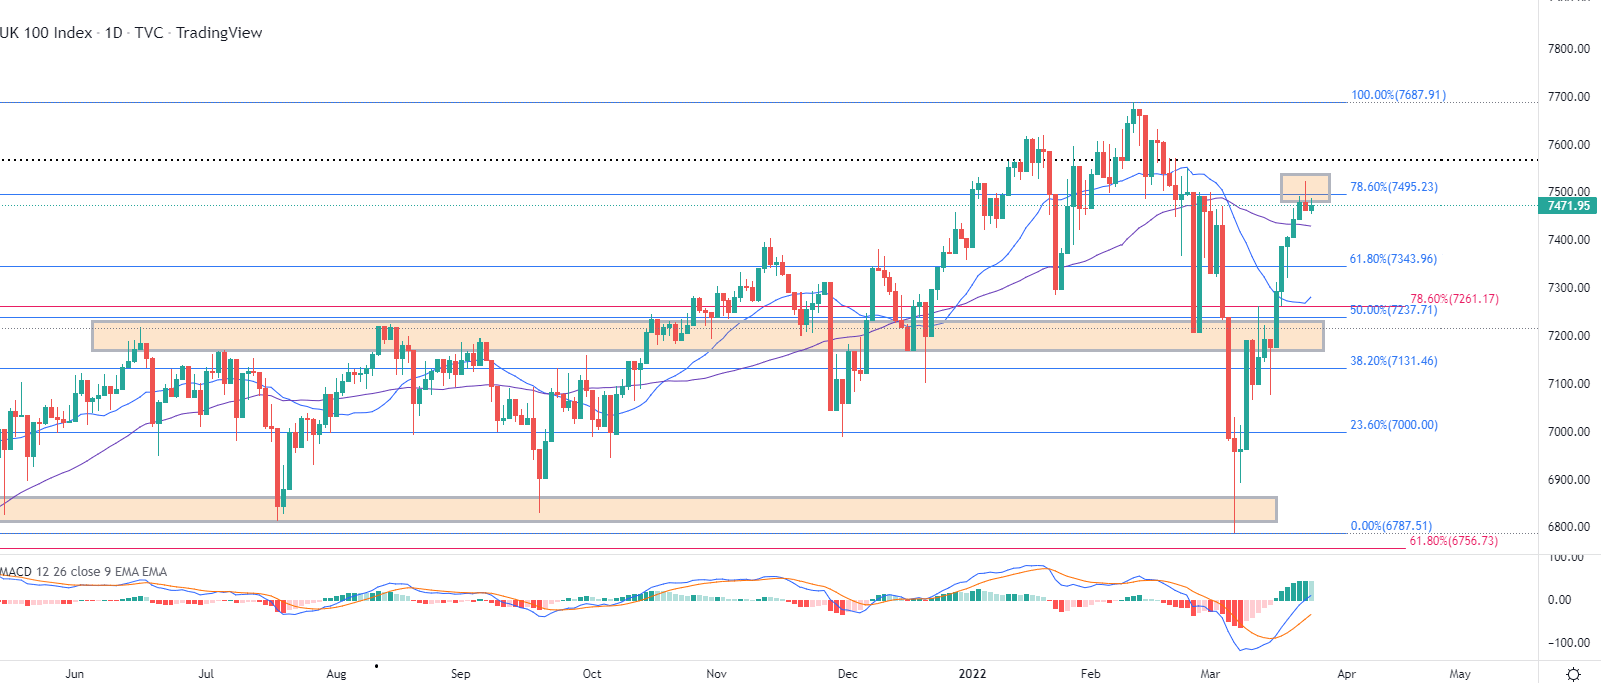
Chart prepared by Tammy Da Costa using TradingView
From a shorter-term perspective, the four-hour chart highlights the indecisive price action as shallow bodies remain in a well-defined range.
Meanwhile, the MACD (moving average convergence/divergence) has crossed above the zero line, a potential indication that upward pressure may continue to subside in the short-term.
FTSE 100 Four-hourChart
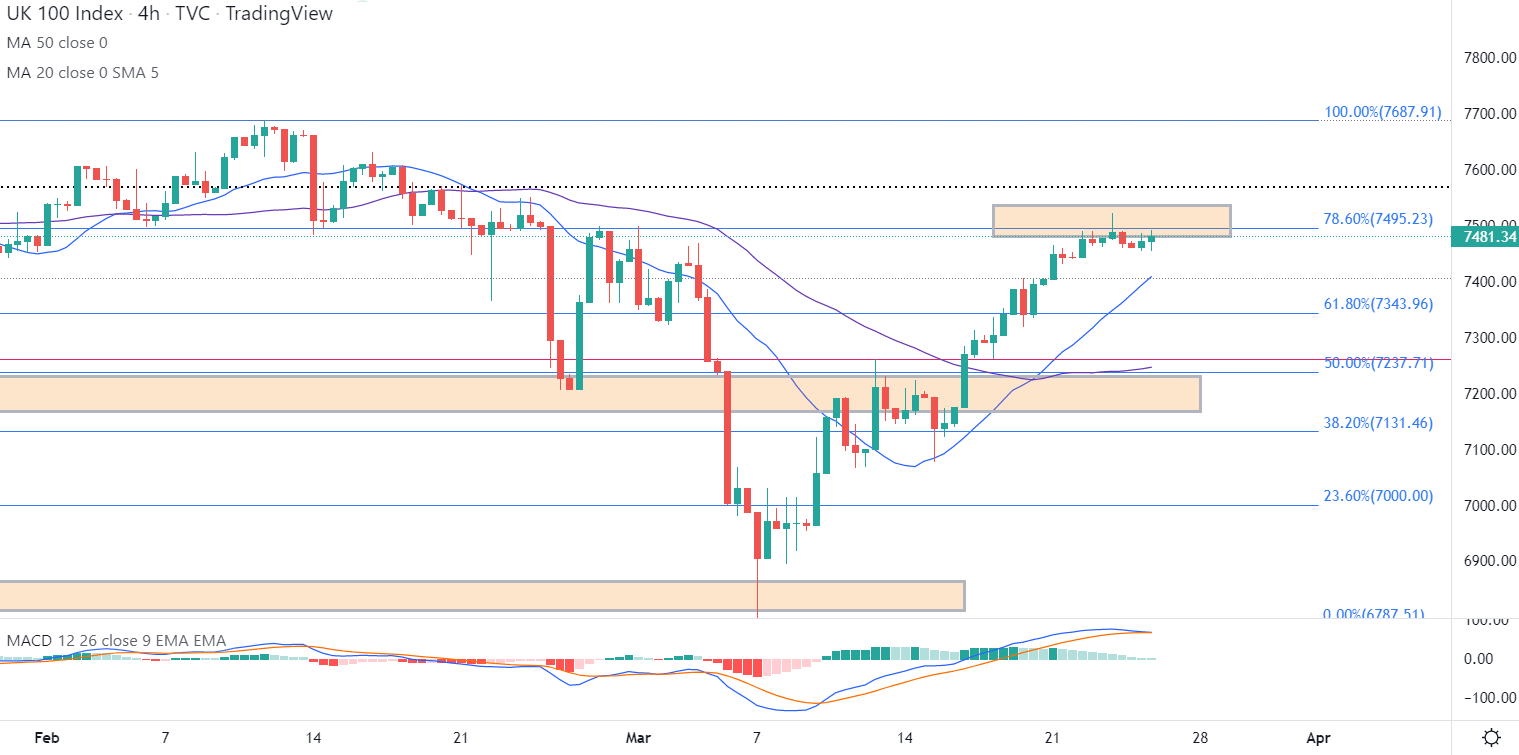
Chart prepared by Tammy Da Costa using TradingView
FTSE Levels to Watch:
Support:
- S1: 7425 (20-day MA)
- S2: 7281 (50-day MA)
- S3: 7000 (key psych level)
Resistance:
- R1: 7500
- R2: 7687 (Feb High)
- R3: 7800

FTSE 100 Market Sentiment
| Change in | Longs | Shorts | OI |
| Daily | 7% | -3% | 0% |
| Weekly | 25% | -13% | -2% |
FTSE 100: At the time of writing, retail trader data shows 39.40% of traders are net-long with the ratio of traders short to long at 1.54 to 1. The number of traders net-long is 14.86% higher than yesterday and 22.21% lower from last week, while the number of traders net-short is 11.62% lower than yesterday and 32.54% higher from last week.
We typically take a contrarian view to crowd sentiment, and the fact traders are net-short suggests FTSE 100 prices may continue to rise.
Positioning is less net-short than yesterday but more net-short from last week. The combination of current sentiment and recent changes gives us a further mixed FTSE 100 trading bias.
--- Written by Tammy Da Costa, Analyst for DailyFX.com
Contact and follow Tammy on Twitter: @Tams707


