


Ethereum (ETH/USD) Charts and Analysis
- The outlook looks positive but challenges lay ahead.
- ETH/BTC spread highlights Ethereum’s recent strength.

Ethereum is starting to move further higher, after slumping between November 2021 and February 2022, with a series of higher lows underpinning the move higher. The positive tailwinds from these higher lows have now pushed ETH/USD to the lower boundary of an important zone of resistance built from a cluster of previous swing lows. This zone, between $3,050 and $3,410, will likely take time to break fully and may see Ethereum trade sideways to slightly higher over the coming weeks in a ‘two steps forward, one step back’ pattern. If Ethereum breaks out of this zone to the topside, the multi-month series of lower highs will have been broken convincingly, adding further positive momentum to the move. The 50-day simple moving average adds a layer of protection to any short-term sell-off.
Ethereum Daily Price Chart – March 24, 2022
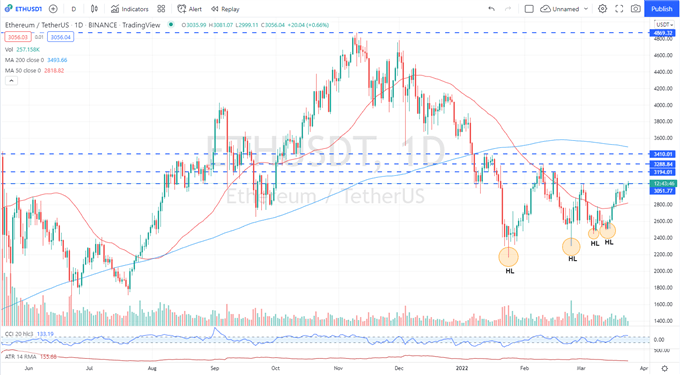
Chart via TradingView
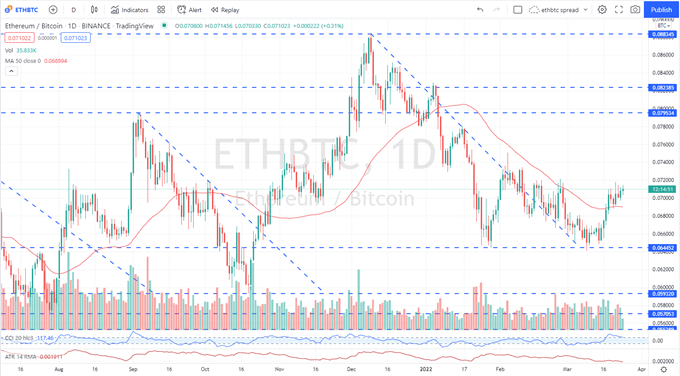
The ETH/BTC spread also highlights Ethereum’s return to favor. The second-largest coin by market cap is currently outperforming Bitcoin with the spread bouncing off a prior horizontal low around 0.0645. This rebound, and the break of the previous downtrend, look to be consolidating before a potential move back to the February 3 spike high at 0.07512. The 50-day sma again acts as first-line support. A long way to go before the December 9 high is threatened, but a target nonetheless.
Ethereum/Bitcoin (ETHBTC) Spread Chart – March 24, 2022
What is your view on Ethereum – bullish or bearish?? You can let us know via the form at the end of this piece or you can contact the author via Twitter @nickcawley1.


