


GBP/USD Price, Chart, and Analysis
- UK GDP beats across the board in January.
- Cable back below 1.3100 and remains pressured.

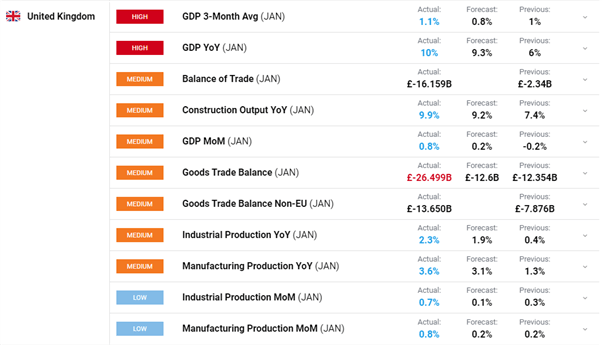
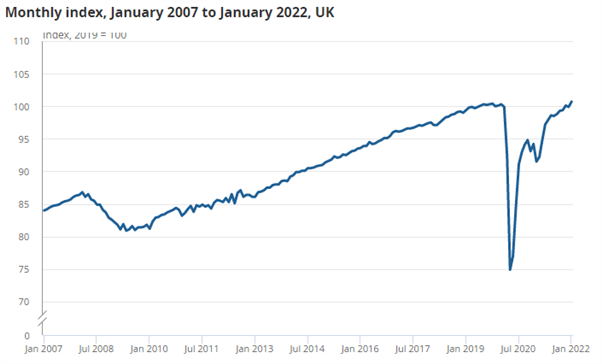
The latest UK GDP figures showed that the economy grew at a better-than-expected rate of 0.8% in January, after falling by 0.2% in December and is now 0.8% above its pre-coronavirus level in February 2020. According to the Office for National Statistics (ONS) release, all sectors grew in January 2022, with services up 0.8%, production up 0.7%, and construction up by 1.1%.
Trade Smarter - Sign up for the DailyFX Newsletter
Receive timely and compelling market commentary from the DailyFX team
Sterling, despite the latest good economic news, continues to slide lower, especially against the US dollar, and is back below 1.3100 and at its lowest level since November 2020. Fears that the crisis in Ukraine will take its toll on UK growth and that inflation is set to rise further have weighed on Sterling. Next week the Bank of England is expected to hike interest rates by a further 25 basis points – with a 50bp hike an outside bet – and the language that the MPC uses when delivering their policy decision, and the voter makeup may underpin the British Pound.
For all market-moving economic data and events, refer to the DailyFX calendar
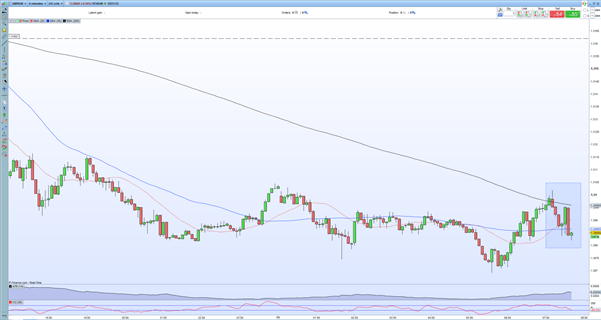
GBP/USD 5 Minute Price Chart – March 11, 2022
Retail trader data show 74.73% of traders are net-long with the ratio of traders long to short at 2.96 to 1. The number of traders net-long is 7.80% higher than yesterday and 29.20% higher from last week, while the number of traders net-short is 1.17% higher than yesterday and 30.85% lower from last week.
We typically take a contrarian view to crowd sentiment, and the fact traders are net-long suggests GBP/USD prices may continue to fall. Traders are further net-long than yesterday and last week, and the combination of current sentiment and recent changes gives a stronger GBP/USD-bearish contrarian trading bias.
| Change in | Longs | Shorts | OI |
| Daily | 0% | -1% | -1% |
| Weekly | -10% | 20% | 0% |
What is your view on GBP/USD – bullish or bearish?? You can let us know via the form at the end of this piece or you can contact the author via Twitter @nickcawley1.


