


RUSSELL 2000 FORECAST:
- The Russell 2000 tumbles as U.S. inflation rises at the fastest pace since 1982
- Lack of progress in peace negotiations between Russia and Ukraine also weighs on sentiment, accelerating the sell-off on Wall Street
- The Russell 2000 near-term outlook remains bearish from a technical perspective
Trade Smarter - Sign up for the DailyFX Newsletter
Receive timely and compelling market commentary from the DailyFX team
Most Read: US Dollar Price Action Setups Post CPI - EUR/USD, GBP/USD & AUD/USD
The Russell 2000 fell Thursday in midday trading, sinking about 1.3% to 1,990, weighed down by risk-averse mood due to rising geopolitical tensions and rampant inflation in the United States. Investor sentiment improved briefly yesterday on expectations that the crisis between Russia and Ukraine could begin to de-escalate soon, but the winds shifted again today after high-level talks between the two countries' foreign ministers failed to produce any progress towards a ceasefire.
To make matters worse, U.S. CPI continued to accelerate and reached 7.9% year-on-year in February, its highest level since 1982, driven by rising fuel, food and housing costs.The commodity market price shock of the past few days did not influence data for this period, so we can effectively say that inflation has not yet peaked, and that much higher readings are likely in the coming months.
Mounting price pressures will lead the Fed to raise interest rates multiple times in 2022, starting at next week's meeting, although the hiking cycle may be less aggressive than anticipated earlier in the year amid extraordinary uncertainty stemming from the military conflict in Eastern Europe. In any case, the direction of travel is toward less accommodation and tighter financial conditions over the forecast horizon.
The transition to a more restrictive monetary policy environment, coupled with weakening activity, runaway inflation, and the war in Ukraine, will ensure that volatility remains elevated for the foreseeable future, complicating the equity market recovery, particularly for cyclically oriented companies that are highly dependent on healthy GDP growth. This leaves the economically sensitive Russell 2000 in a precarious situation and vulnerable to near-term weakness.

From a price action perspective, the outlook is bleak for the Russell 2000. Looking at the daily chart, we can see that the index is currently trading below its 200-day, 100-day and 50-day simple moving averages, and has been making lower highs and lower lows in recent months, two bearish signals that reinforce the argument that the path of least resistance is south.
In this regard, if the small and mid-cap stock benchmark stays on a downward trajectory, bears may attempt to launch on assault on 1,890/1,895. This technical support, defined by the 38.2% Fibonacci retracement of the 2020/2021 rally, has been tested twice in recent weeks, successfully repelling sellers each time. Should it be tested again, we may see a bounce from these levels, but if the floor breached, all bets are off, with a breakout exposing the 1,815 region.
On the flip side, if buyers return and bid price higher, resistance is seen near the 2,065 area, where the March high aligns with the 50-day SMA and a descending trendline in play since November last year. If bulls manage to push the index above this barrier, the next upside focus appears at 2,105 (February high). A sustained move above 2,105 and monthly higher high is required to resuscitate buying momentum and improve the near-term outlook.
RUSSELL 2000 TECHNICAL CHART
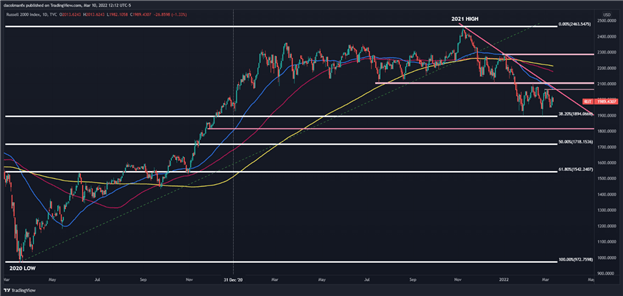
Russell 2000 Chart prepared using TradingView
EDUCATION TOOLS FOR TRADERS
- Are you just getting started? Download the beginners’ guide for FX traders
- Would you like to know more about your trading personality? Take the DailyFX quiz and find out
- IG's client positioning data provides valuable information on market sentiment. Get your free guide on how to use this powerful trading indicator here.
---Written by Diego Colman, Contributor


