


FTSE 100 News and Analysis
- FTSE 100 loses grip, Ukraine and Russia fail to reach an agreement
- UK oil ban and elevated inflation weigh on FTSE 100
- FTSE 100 support and resistance remain ‘trapped’ between key technical levels

FTSE 100 Pressured by Inflationary Fears
Global risk sentiment soured once again after a brief optimistic tilt. As hopes of a near-term ‘diplomatic solution’ between Russia and Ukraine dissipated, the FTSE 100 returned some its recent gains as the sanctions on Russian oil and the retaliation by President Vladimir Putin placed inflation and energy prices back in the spotlight.
After a steep rally which allowed FTSE 100 to rise back above the key psychological level of 7,000, failure to reclaim the 200-day MA (moving average) and gain favor above the 23.6% Fibonacci level of the Oct 2020 move at around 7,17856 has forced price action back into a zone of confluency which continue to provide support and resistance for the short-term move.
FTSE 100 Daily Chart
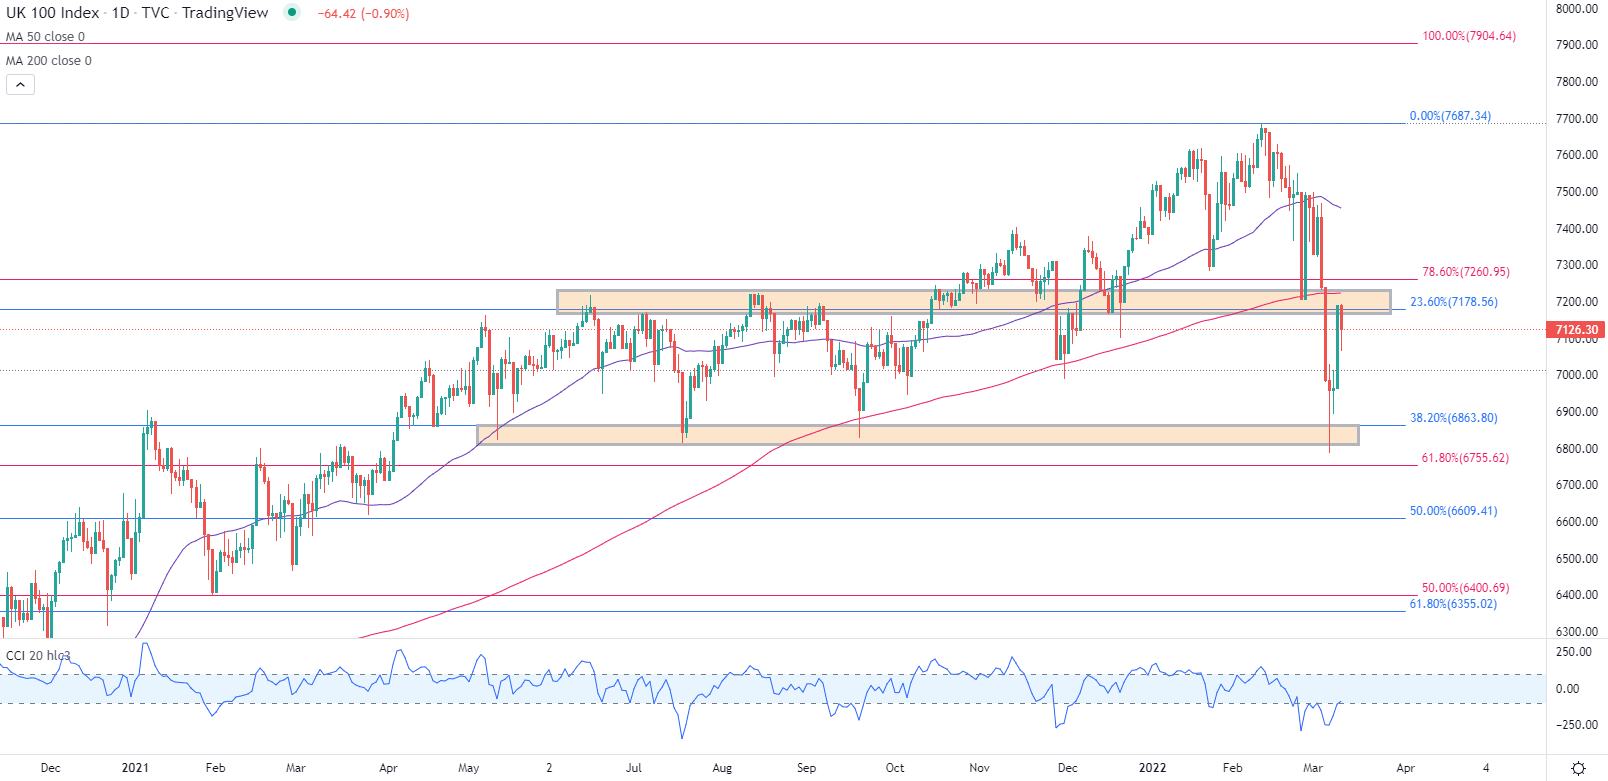
Chart prepared by Tammy Da Costa using TradingView
FTSE 100 Key Levels:
Support:
S1: 7000
S2: 6863
S3: 6755
Resistance:
R1: 7180
R2: 7260
R3: 7400

FTSE 100 Market Sentiment
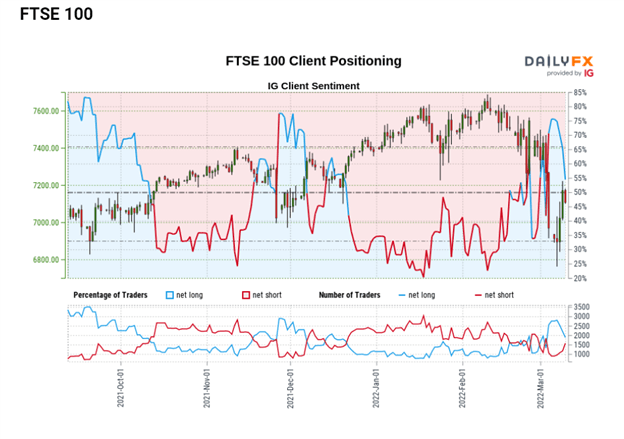
FTSE 100: At the time of writing, retail trader data shows 57.35% of traders are net-long with the ratio of traders long to short at 1.34 to 1. The number of traders net-long is 8.79% lower than yesterday and 24.40% higher from last week, while the number of traders net-short is 7.83% higher than yesterday and 12.87% lower from last week.
We typically take a contrarian view to crowd sentiment, and the fact traders are net-long suggests FTSE 100 prices may continue to fall.
Positioning is less net-long than yesterday but more net-long from last week. The combination of current sentiment and recent changes gives us a further mixed FTSE 100 trading bias.
| Change in | Longs | Shorts | OI |
| Daily | 48% | -3% | 6% |
| Weekly | -11% | 50% | 28% |
--- Written by Tammy Da Costa, Analyst for DailyFX.com
Contact and follow Tammy on Twitter: @Tams707


