


DOW JONES, HANG SENG INDEX, ASX 200 INDEX OUTLOOK:
- Dow Jones, S&P 500 and Nasdaq 100 indexes closed +2.00%, +2.57% and +3.58% respectively
- Stock markets rebounded strongly as Ukraine talks were reported to be making progress. Crude oil fell
- Asia-Pacific equities to open higher. Investors will be eyeing US inflation data for more clues

Dow Jones, Market Rebound, Crude Oil, US Inflation, Asia-Pacific at Open:
Wall Street equities rebounded sharply overnight as dip buyers stepped in for bargain hunting after Russia said “some progress has been made” in talks with Kyiv towards reaching a ceasefire agreement. The German DAX index soared 7.92% overnight, marking its largest single day gain in years. Safe havens such as gold, US Dollar and Treasuries fell, underpinning improved risk appetite as investors may believe that the Ukraine crisis and the follow-on sanctions may have already been priced in. Crude oil tumbled 12% amid profit taking as Ukraine tensions eased.
Amazonsaw its share price soar 6.7% during after-market trade after the company announced a share split and $10 billion buyback plan, which will remove hurdles for its inclusion in the Dow Jones Industrial Average index.
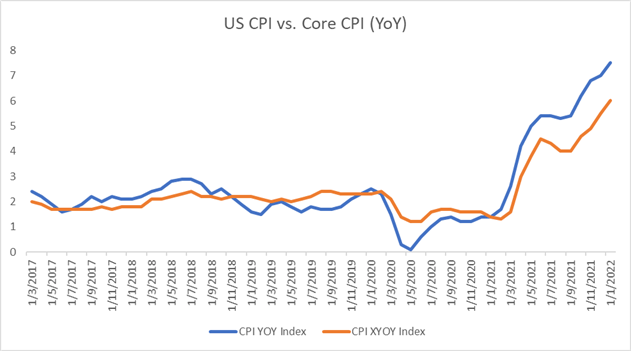
Looking ahead, investors will focus on US inflation data to be released later today. The consumer price index (CPI) is expected to hit 7.9% in February, marking a fresh four-decade high. The core inflation, which strips volatile food and energy items, is likely to come in at 6.4%. If actual readings surpass forecasts, investors may be even more worried about rising price levels and their ramifications for wage pressure and corporates’ profit margins. Russia’s invasion of Ukraine propelled commodity prices around the globe, leaving economies embracing a new wave of inflation in the months to come.
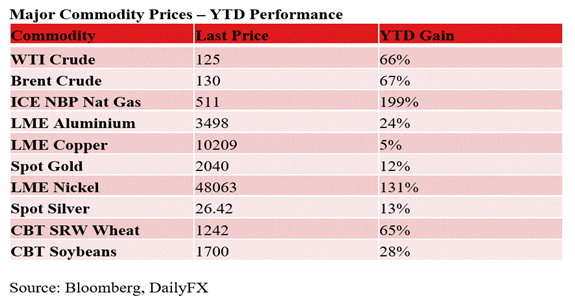
Source: Bloomberg, DailyFX as at 9th March 2022
This will provide a challenging task for the Fed and other central banks, which need to tackle rising price levels with higher interest rates. On the flip side, heightened geopolitical risks and global supply chain disruptions may hinder the Fed’s roadmap for tightening. The FOMC meeting scheduled next week will be closely eyed by investors around the world.
Crude oil prices hit the highest level since 2008 before pulling back sharply on Wednesday. It suggests that the US ban on Russian oil imports have likely been priced in, and traders are “selling the fact”. Falling oil prices may alleviate concerns about the negative impact on economic recoveries as the cost of energy and raw material prices abates. This is particularly good news for Asia’s major oil-importing countries such as China, Japan and India.
Source: Bloomberg, DailyFX
Hong Kong’s Hang Seng Index (HSI) may embrace a rebound on Thursday after experiencing a huge intraday price swing on the prior day. Norway’s sovereign wealth fund said it will divest its stake in China’s sportswear maker Li Ning, which is a Hang Seng Index constituent, due to suspicions of forced labor used in the Xinjiang province. Its share price plunged nearly 10%, sending shockwaves to the rest of the market. Meanwhile, China’s leading nickel producer TsingshanHoldingGroup was reported to have secured loans to help it meet margin calls amid a historic short squeeze.
Looking ahead, the ECB interest rate decision dominates the economic docket alongside and US inflation data. Find out more from the DailyFX economic calendar.
Looking back to Wednesday’s close, all 9 S&P 500 sectors ended higher, with 80.6% of the index’s constituents closing in the green. Information technology (+3.78 %), financials (+3.71%) and materials (+3.39%) were among the best performers, whereas energy (-2.5%) trailed behind.
Dow Jones Sector Performance 09-03-2022
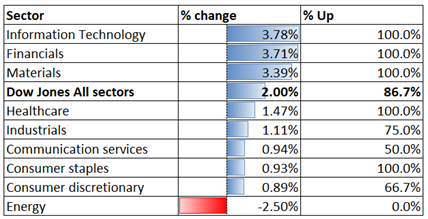
Source: Bloomberg, DailyFX
Dow Jones Index Technical Analysis
The Dow Jones index may have formed a “Double Bottom” chart pattern as highlighted on the chart below. This suggests that price may have reached a near-term bottom and may embrace a technical rebound. Holding above a key support level of 32,940 may pave the way for further upside potential with an eye on 34,040. The overall trend remains bearish biased however, as price formed consecutive lower highs and lower lows over the past few months.
Dow JonesIndex – Daily Chart
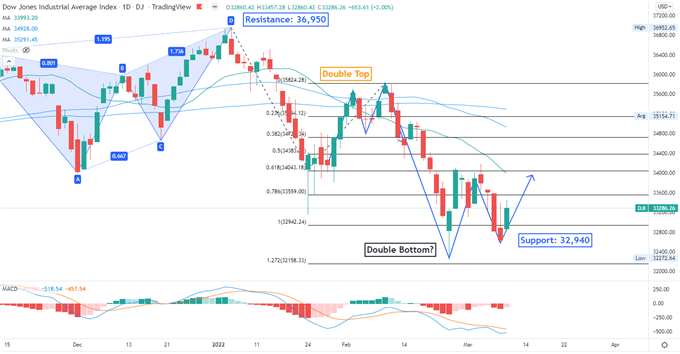
Chart created with TradingView
Hang Seng Index Technical Analysis:
The Hang Seng Index (HSI) breached below multiple support levels and extended lower, underscoring strong selling pressure. An immediate support level can be found at 20,830 – the 200% Fibonacci extension. Holding above this level may pave the way for a technical rebound. The MACD indicator dived deeply in to the negative territory, suggesting that prices may be severely oversold.
Hang Seng Index – Daily Chart
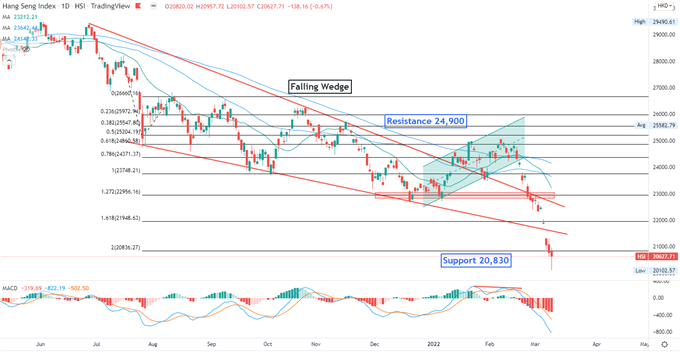
Chart created with TradingView
ASX 200 Index Technical Analysis:
The ASX 200 index formed a “Double Top” chart pattern and has since entered a technical correction. An immediate support level can be found at 6,960 – the 23.6% Fibonacci retracement. Breaching below this level may intensify near-term selling pressure and expose the next support level of 6,758. A key resistance level can be found at 9,290, the previous high.
ASX 200 Index – Daily Chart
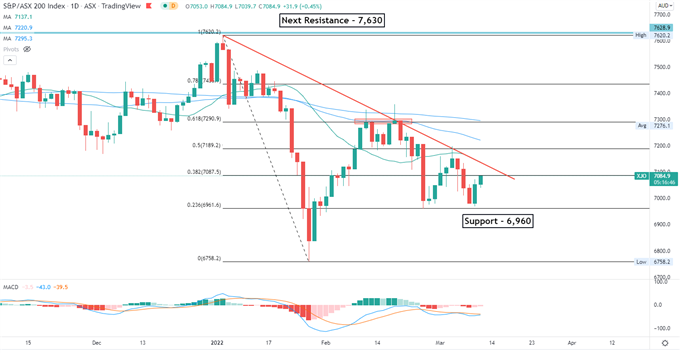
Chart created with TradingView

--- Written by Margaret Yang, Strategist for DailyFX.com
To contact Margaret, use the Comments section below or @margaretyjy on Twitter


