


S&P 500, FTSE 100, DAX 40: Prices, Charts, and Analysis
- Equity markets hitting multi-month lows.
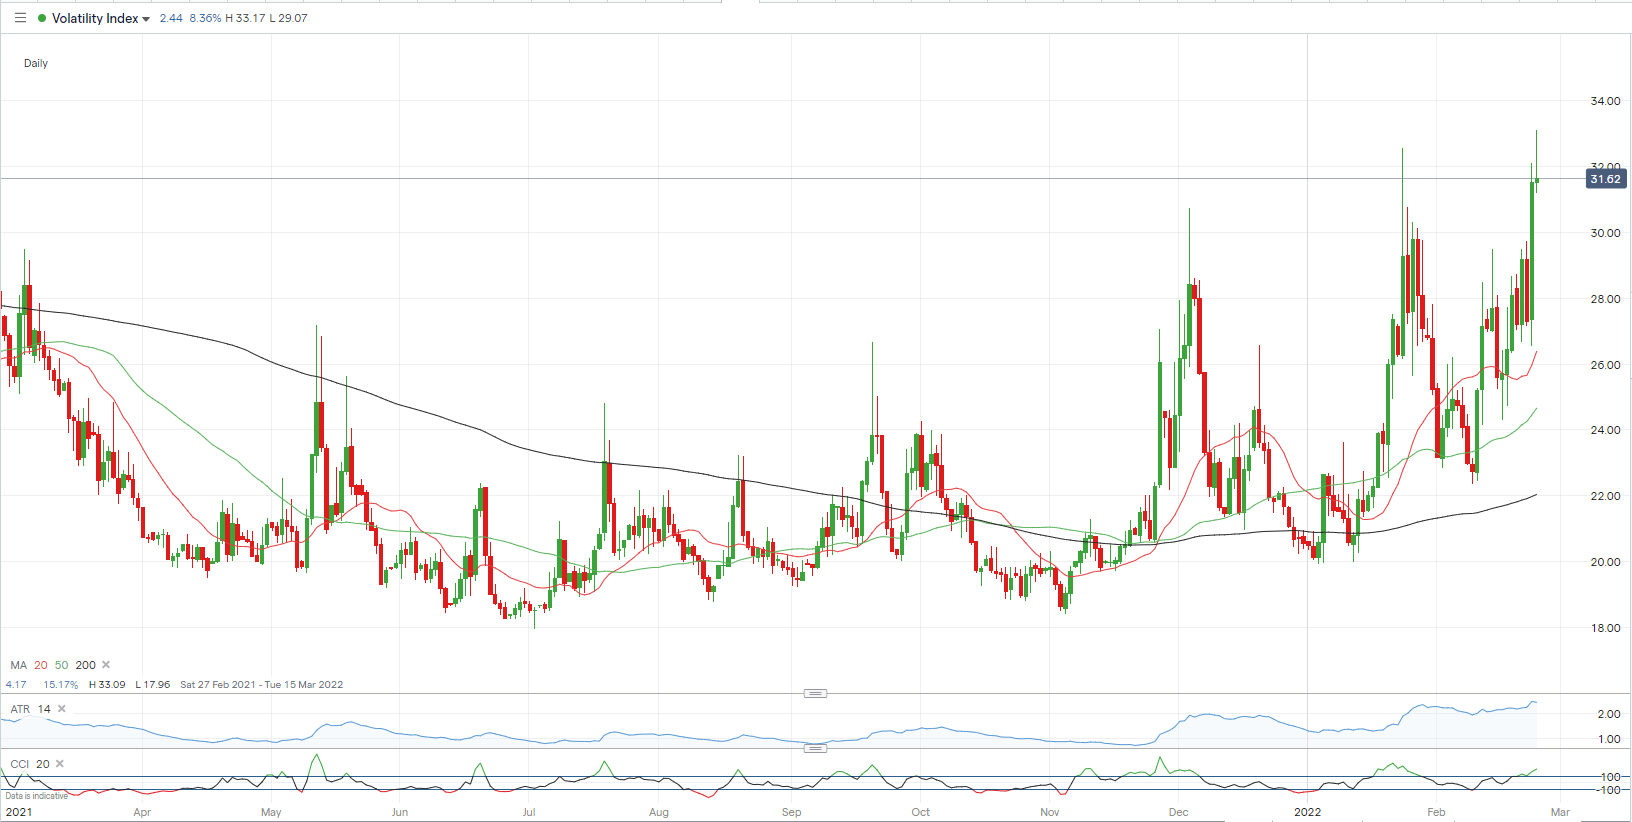
- Further volatility is expected going into month-end.

Global stock markets have made fresh multi-month lows on news that Russian forces have invaded Ukraine, confirming Western fears. The markets are now waiting for confirmation of increased sanctions by the US, EU, and the UK to Russia’s aggression and these embargoes will only add to the current heightened levels of volatility in a range of asset classes. While these new sanctions may eventually bring a level of calm to the market, in the meantime expect heavy swings either way in all equity indices.
While the crisis in Ukraine remains the dominant driver of risk and markets currently, month-end equity portfolio rebalancing may also add an extra dose of volatility in the coming days.
VIX Index Daily Chart - February 24, 2022
How to Short Sell a Stock When Trading Falling Markets
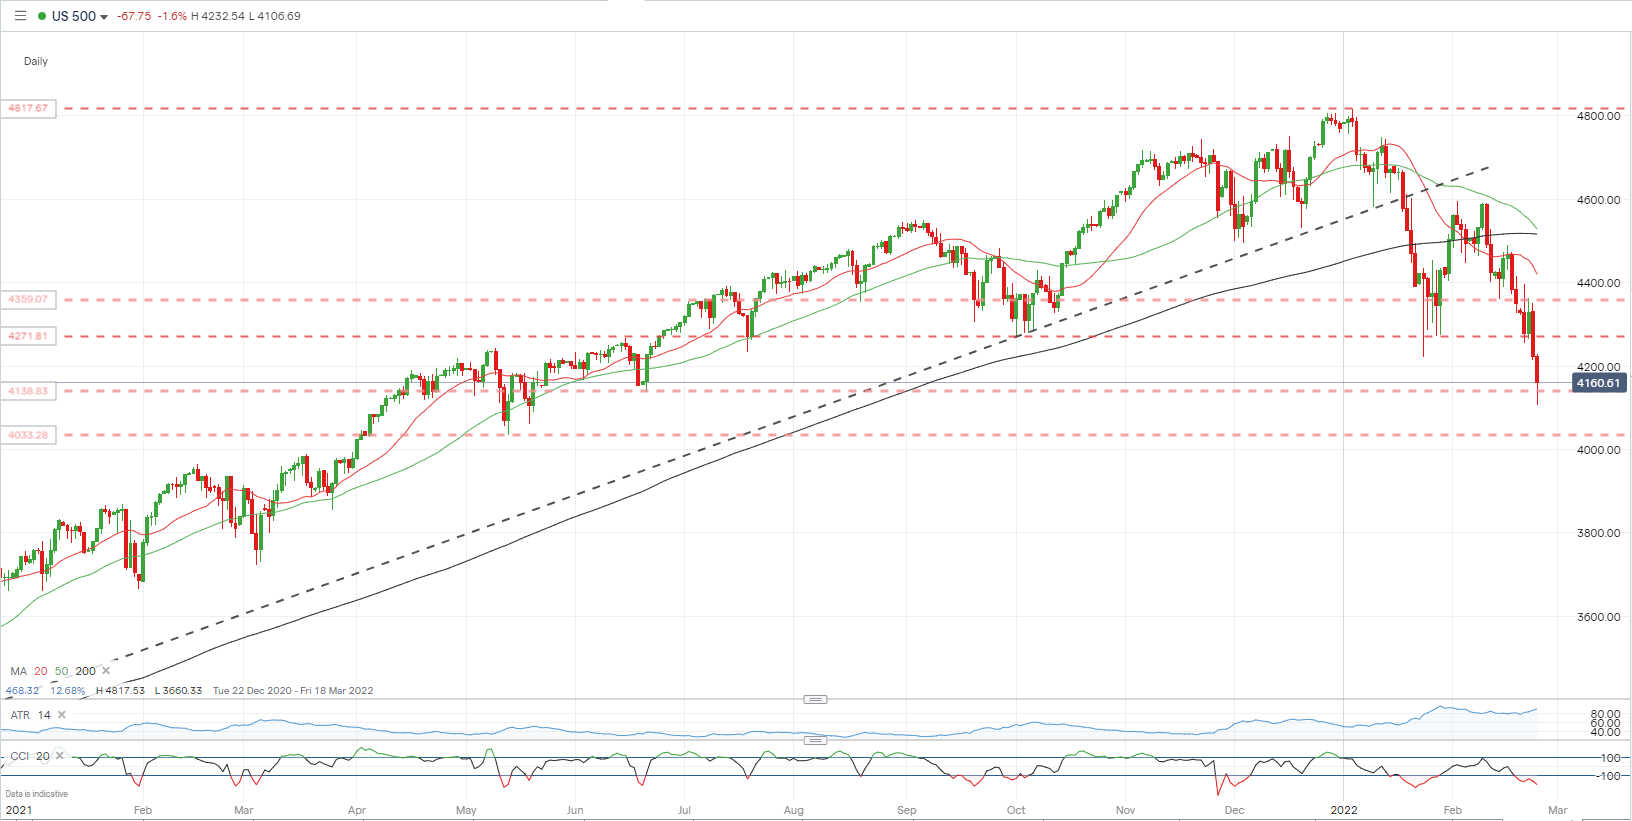
The S&P 500 is now back at levels last seen in May last year and has lost over 14% since printing an all-time high in early January. Horizontal support from prior swing lows continues to come under pressure and until the overall situation becomes clearer, further sell-offs cannot be discounted. The CCI indicator shows the S&P 500 in oversold territory and this may act as a short-term buffer against further sharp falls.
S&P 500 Daily Price Chart - February 24, 2022
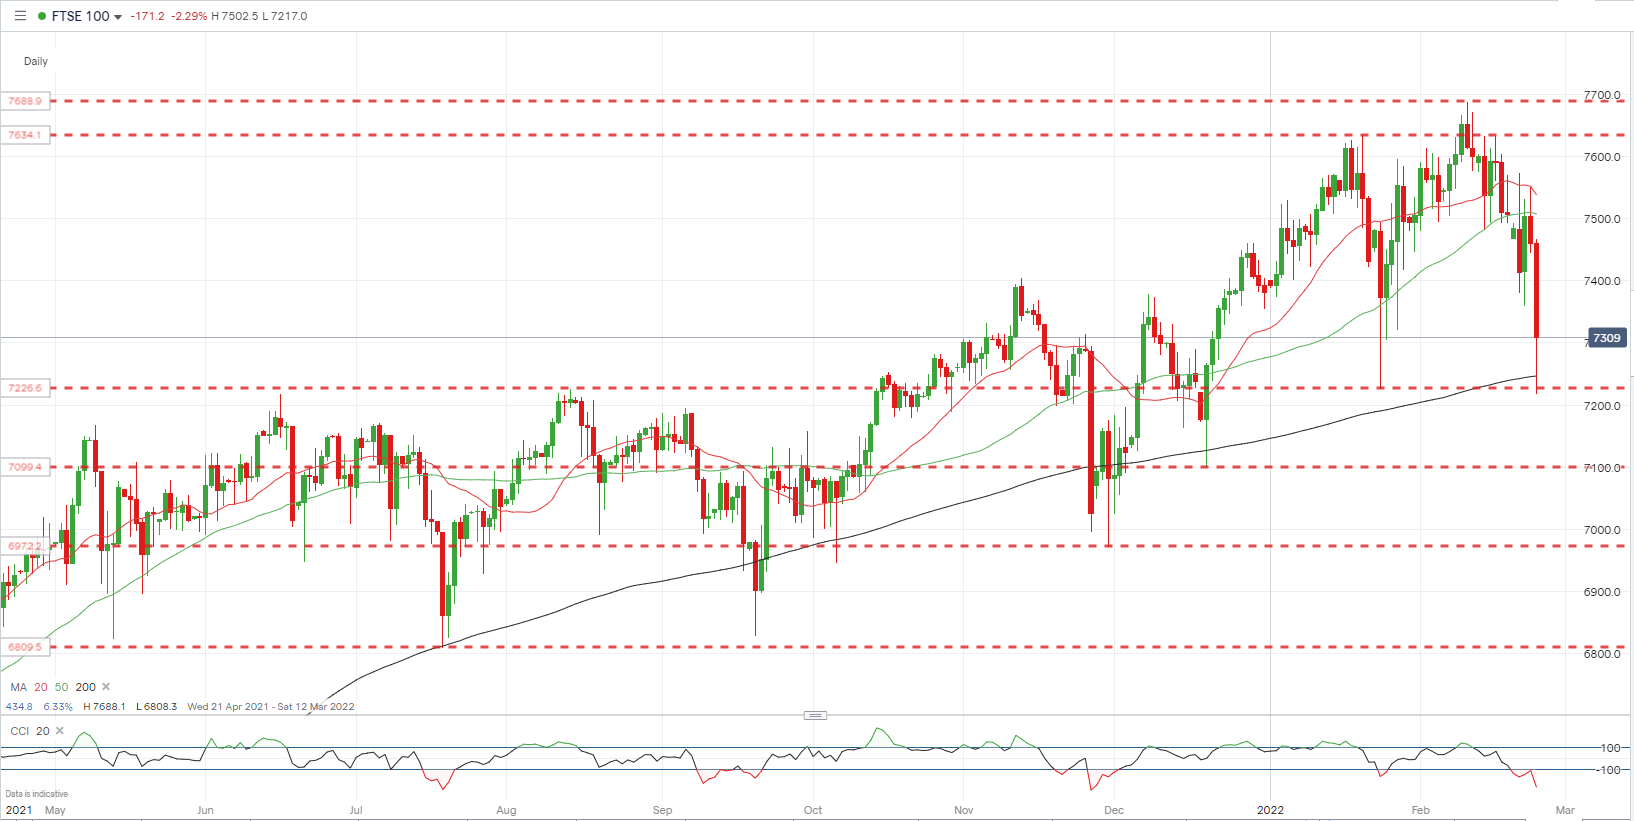
The FTSE 100 is also under pressure but the indices’ composition is helping to stem further losses at the moment. The FTSE is heavily skewed towards large oil and commodity companies and with the prices of these commodities pushing ever higher, and with a weaker GBPUSD rate helping FTSE exporters, further losses may be contained for now. Recent losses have also pushed the CCI indicator into heavily oversold territory.
FTSE 100 Daily Price Chart – February 24, 2022

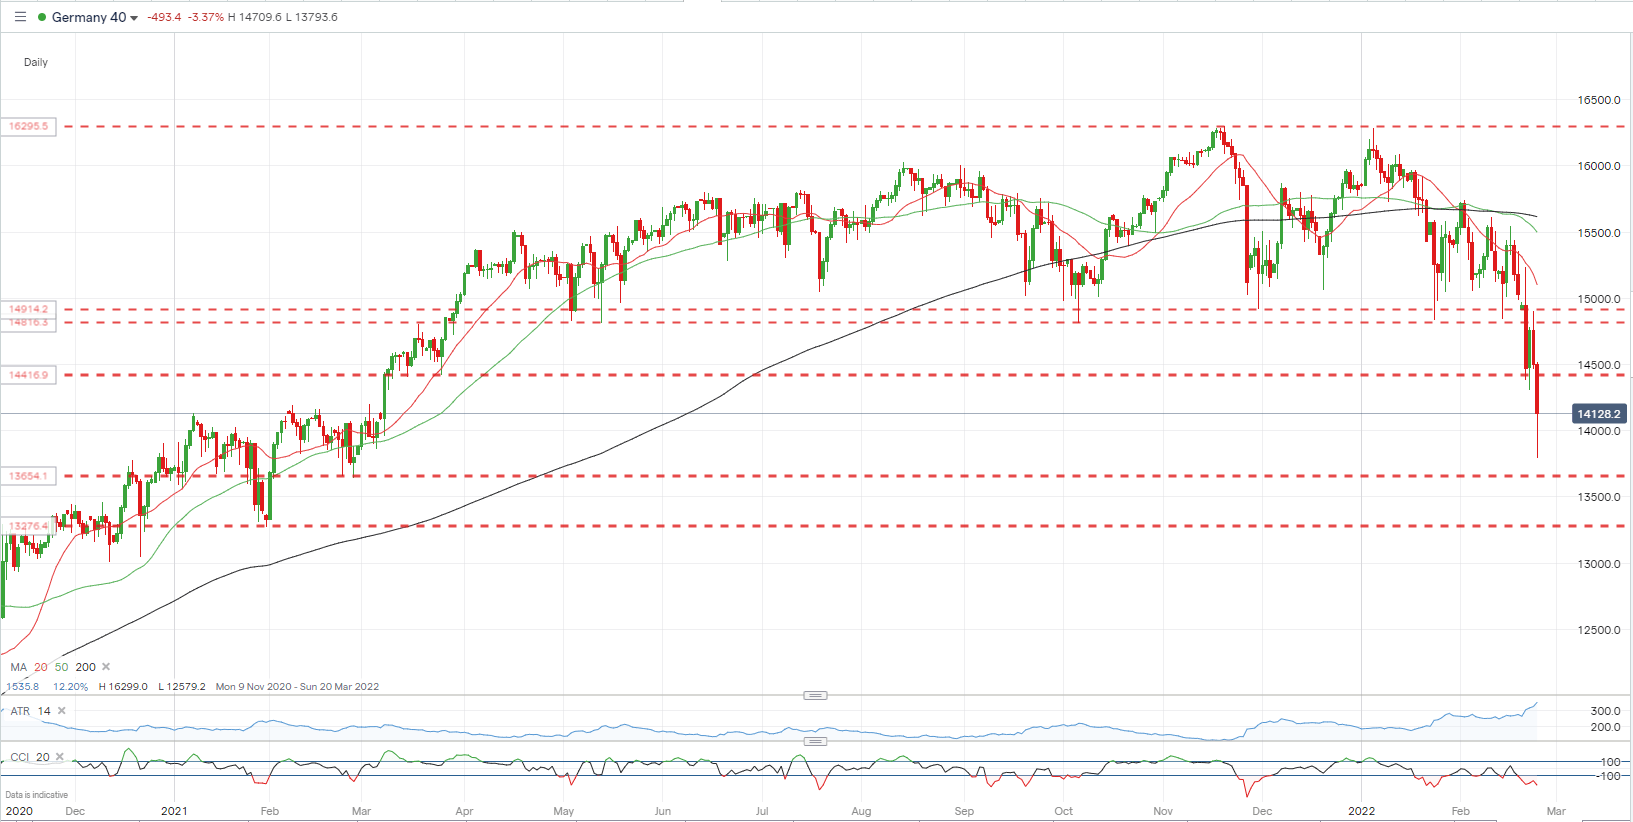
The DAX 40, in contrast to the FTSE 100, is being hit harder due to Germany’s heavy reliance on Russian energy. The DAX is over 2,000 points lower than the double high seen in mid-November and early-January, while volatility is at a multi-month high.
DAX 40 Daily Price Chart – February 24, 2022
What is your view on Equities and Risk – bullish or bearish?? You can let us know via the form at the end of this piece or you can contact the author via Twitter @nickcawley1.


