


CHF, JPY, USD, Russia-Ukraine Talking Points
- Will Russia-Ukraine tensions overshadow rate hikes?
- USD/JPY consolidates amid mixed sentiment
- USD/CHF remains within the confines of a potential symmetrical triangle
Can Russia-Ukraine tensions support safe-haven currencies?
Safe-haven currencies JPY, CHF and USD have recently benefited from an increase in the tensions between Russia and Ukraine, allowing them to remain supported against major counterparts.
Visit the DailyFX Educational Center to discover how to trade the impact of politics on global markets
Although the BoJ (Bank of Japan) and the SNB (Swiss National Bank) have maintained an accommodative stance to monetary policy, the Federal Reserve is expected to begin rate hikes in March in order to tackle rising inflation which has in turn, lifted yields higher, supporting the US Dollar.
With Western leaders and Japan now imposing sanctions against Russia, risk sentiment eased slightly, pushing USD/JPY and USD/CHF into a well-defined range

USD/CHF Technical Analysis
As USD/CHF tracks the 50-day MA (moving average), whipsaw price action has caused the potential development of a symmetrical triangle on the daily time-frame. With prices currently trading above trendline support, key Fibonacci levels of the 2019 – 2021 move are assisting with providing additional levels of support and resistance between 0.915 and 0.930 respectively.
Meanwhile, the CCI (commodity channel index) continues to trade towards the lower bound of the range, suggesting that the pair may be threatening oversold territory.

USD/CHF Daily Chart
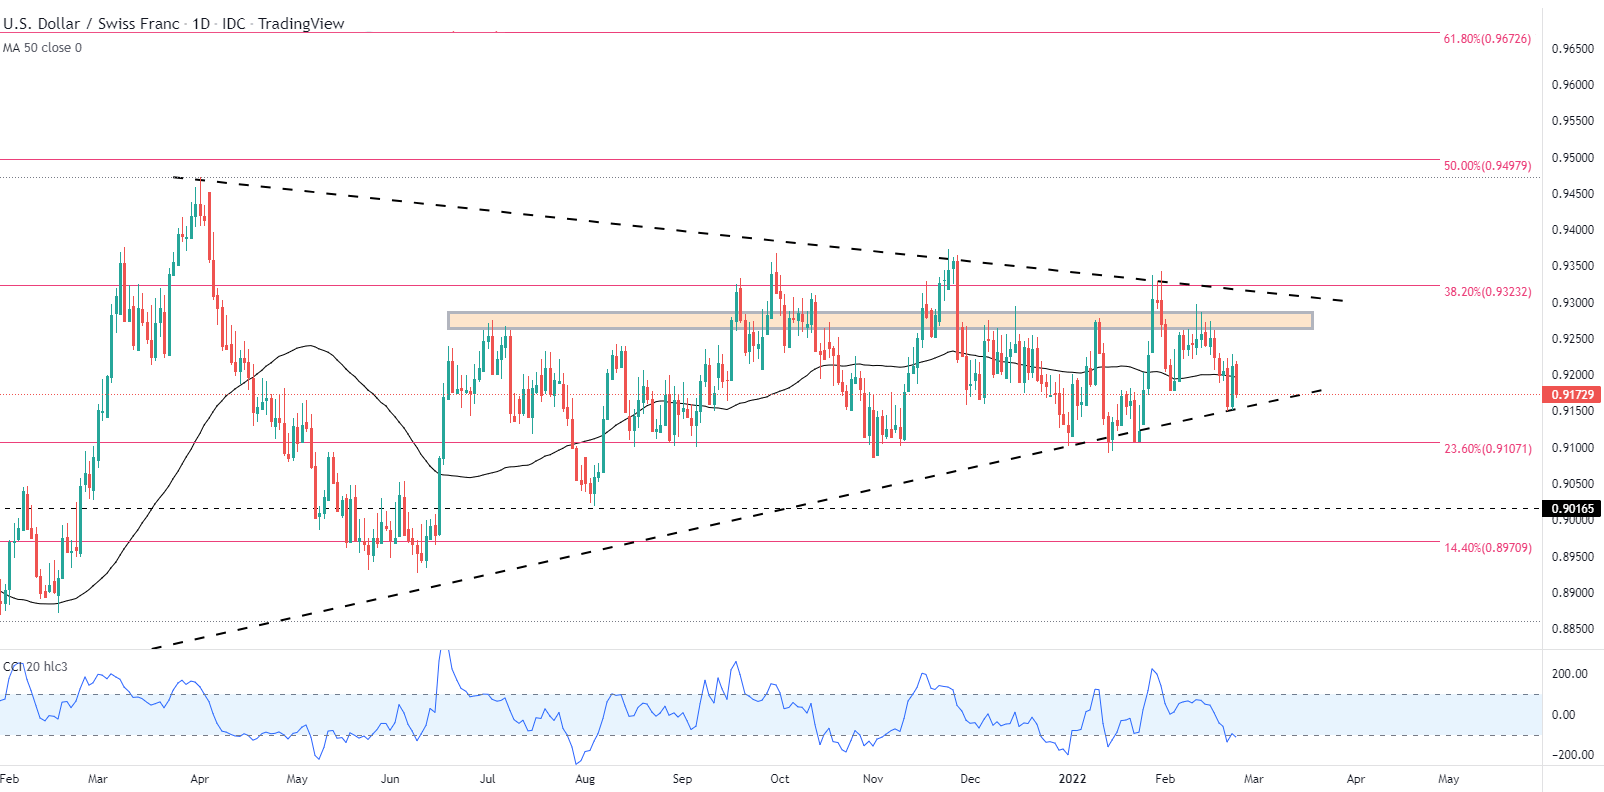
Chart prepared by Tammy Da Costa using Tradingview
If the retracement turns out to be a mere correction in prices, bulls may have the opportunity to regain dominance over the trend, resulting in a probable retest of the next big level of 0.930. If bullish continuation prevails, the next level of resistance holds at the November high 0.937 which leaves the door open for the 2021 high at 0.947.
| Change in | Longs | Shorts | OI |
| Daily | -7% | -15% | -10% |
| Weekly | -3% | -16% | -9% |
USD/JPY Technical Analysis
USD/JPY has recently been trading within a confluent zone, formed by key Fibonacci levels of historical moves. After retesting January highs earlier this month, failure for bullish momentum to hold above the critical psychological level of 116.00 resulted in a potential double-top formation on the daily chart, allowing bears to drive prices back towards the rising trendline (from Oct 2021) currently holding as support.
With investors now balancing between the escalating tensions and higher rates, USD/JPY remains above the 50-day MA (moving average) while the MACD (moving average convergence/divergence) trades above the zero-line.
USD/JPY Daily Chart
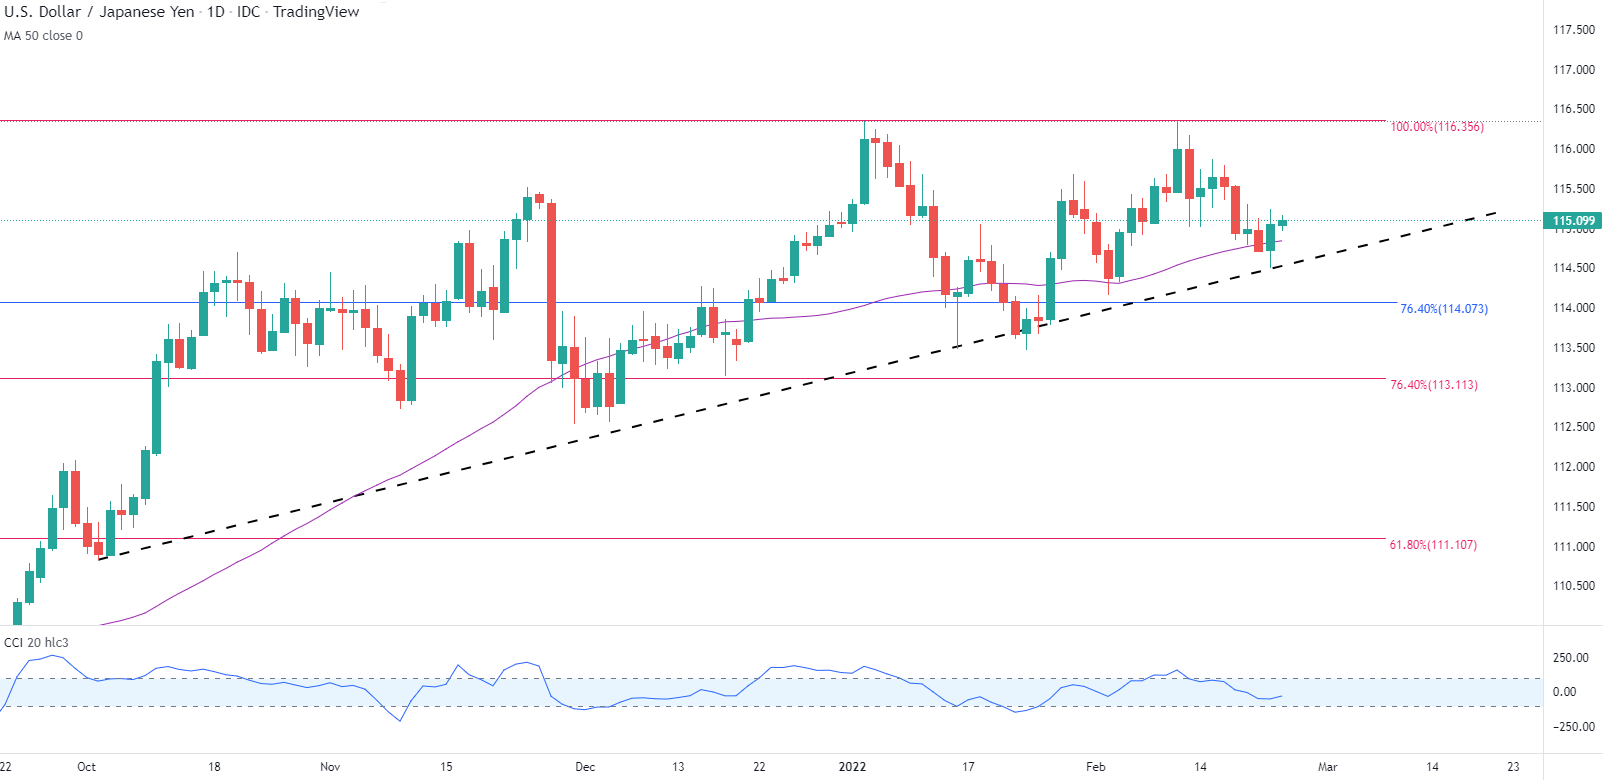
Chart prepared by Tammy Da Costa using Tradingview
As long as trendline support continues to hold, a break above 115.500 may give rise for a potential retest of the yearly high at 116.356.
In contrast, a break below trendline support and below the 114.073 Fibonacci level paves the way for the 113.113 spot and towards the 61.8% level of the 2021 – 2022 move at 111.107.
| Change in | Longs | Shorts | OI |
| Daily | -17% | -2% | -4% |
| Weekly | -13% | 5% | 2% |
--- Written by Tammy Da Costa, Analyst for DailyFX.com
Contact and follow Tammy on Twitter: @Tams707


