


Bitcoin, USD Talking Points
- Bitcoin prices surge, easing Russia-Ukraine tensions boost gains
- BTC/USD clings to $400,000 in an effort to retest February highs.
- Price action remains conflicted at key Fibonacci levels

Bitcoin prices are currently trading approximately 4% higher for the day after Russia announced that it was planning to withdraw some troops from the Ukrainian border. With the ‘partial troops pullback’ decision supporting riskier assets, BTC/USD remains supported above $44,000.
As risk sentiment and major event risk continue to drive sentiment, prices remain between key technical levels which will likely play an additional role in determining Bitcoin’s next move.

Bitcoin (BTC/USD) Technical Analysis
After breaking above the falling wedge earlier this month, the momentum of the bullish trend gained traction before running into a wall of resistance at $44,000, a level which continues to hold bulls at bay.
Bitcoin Daily Chart
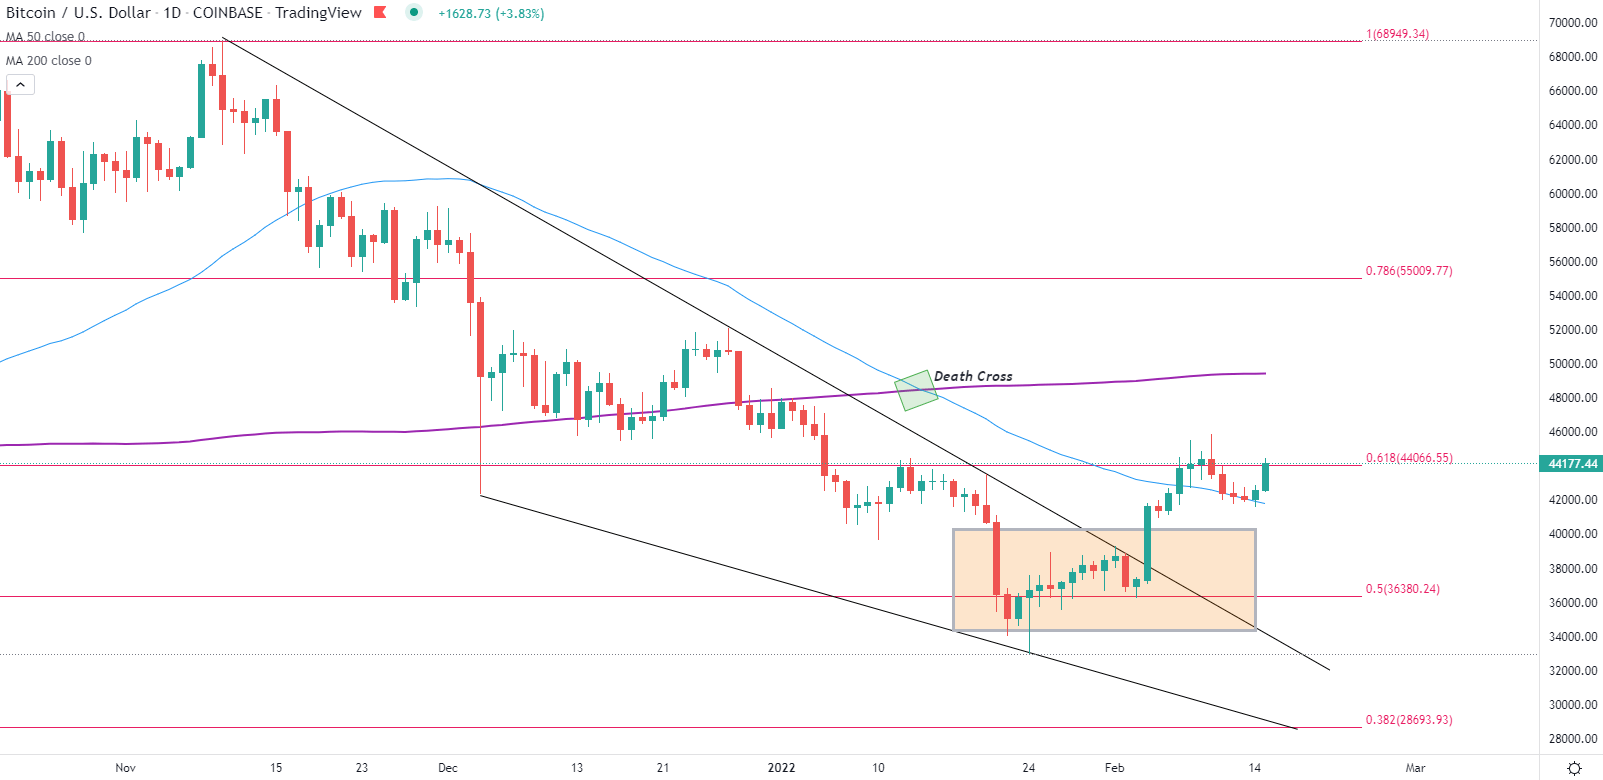
Source: TradingView, Chart by Tammy Da Costa

Meanwhile, on the hourly chart below, prices remain above the 200-period MA (moving average) at $43,258, which continues to provide support for the imminent move. After failing to break above current resistance at $44,000, bears were temporarily able to dive prices lower throughout last week before rebounding off of the prominent level of support at $42,000.
Now, as tensions between Russia and the Ukraine appear to ease, ‘risk-on’ sentiment has enabled BTC/USD to regain confidence as bulls aim to break through the 61.% Fibonacci retracement at $44,066. A break above that level could see a retest of $46,000 and towards the next level of $50,000.
Bitcoin Hourly Chart
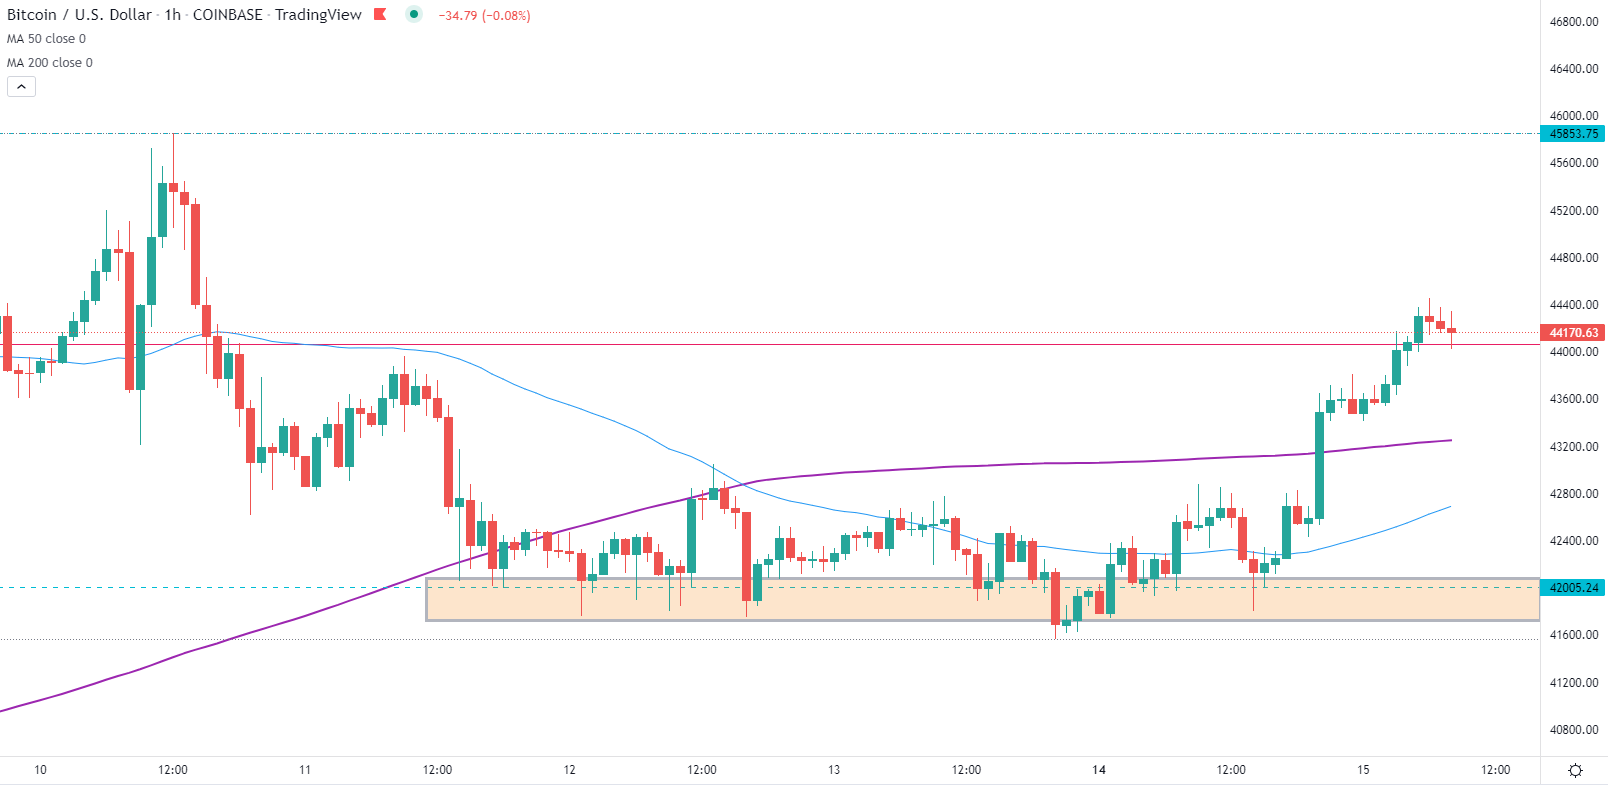
Source: TradingView, Chart by Tammy Da Costa
--- Written by Tammy Da Costa, Analyst for DailyFX.com
Contact and follow Tammy on Twitter: @Tams707


