


Crude Oil, WTI, Brent – Talking Points
- Crude oil prices retreat after eight weeks of gains
- Russia-Ukraine tensions support rising prices
- Higher energy costs buoy concerns over rising inflation

Potential Russia-Ukraine Invasion Boost Demand for Oil
Crude oil prices have continued to remain above the key psychological level of $90,00 as rising Russia-Ukraine tensions support the upward trajectory.
After eight consecutive weeks of gains, WTI crude oil prices temporarily threatened the upper bound of the rising channel resistance before easing back towards the $90,00 mark.

With price action recently making fresh seven-year highs, the 61.8% Fibonacci level (of the historical move) continues to provide support at $91.00 with additional support held by the 50-day MA (moving average) at around $81,00.
US Crude (WTI Crude) Weekly Chart
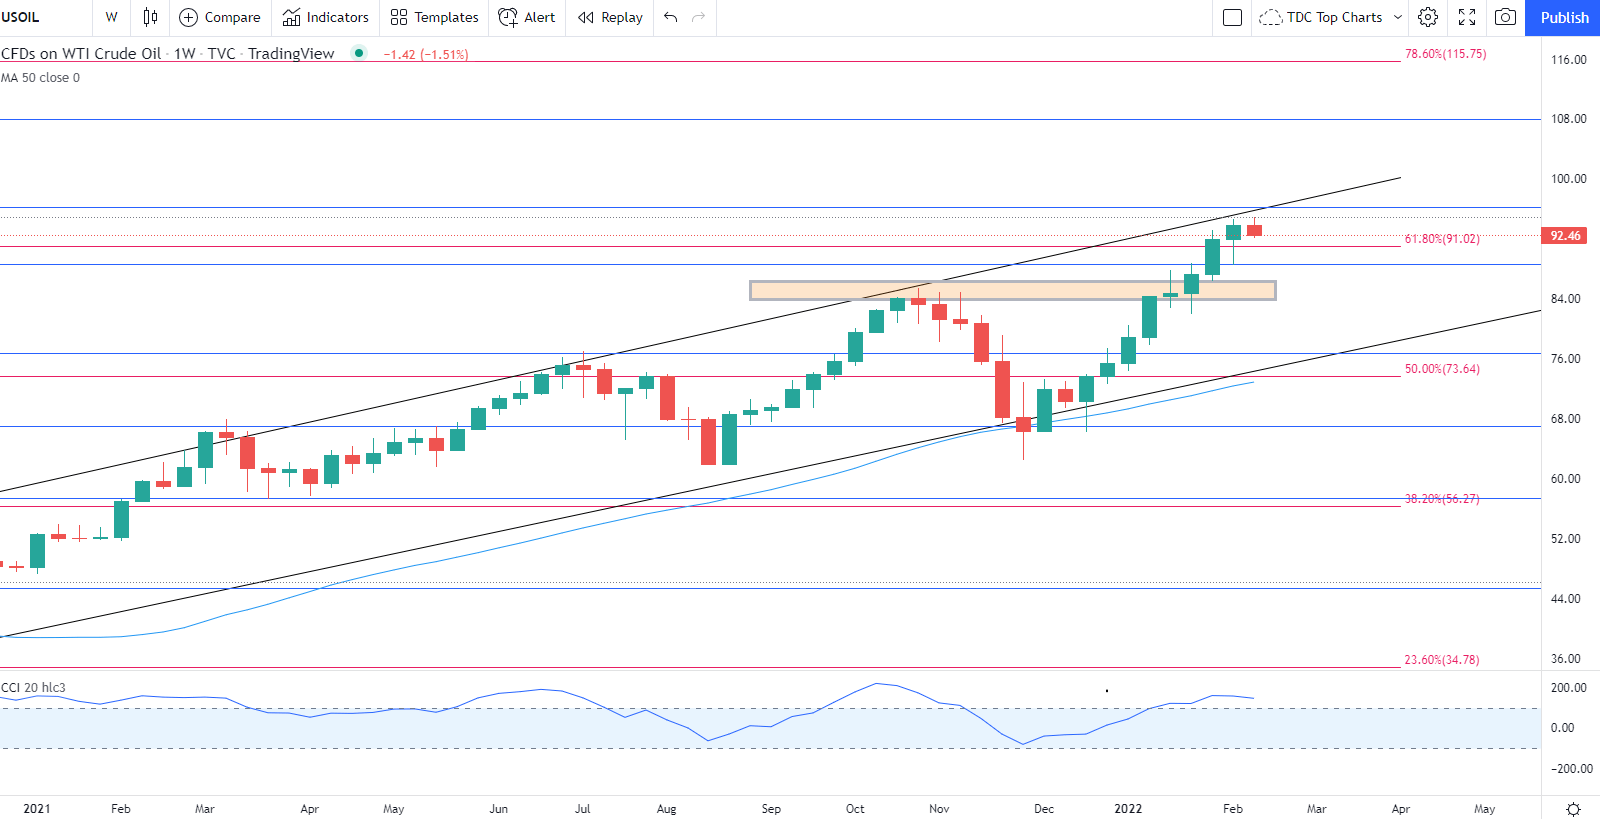
Chart prepared by Tammy Da Costa using TradingView
As the CCI (commodity channel index) trades in overbought territory on both the weekly and daily chart, bulls will need maintain dominance over the primary trend. A break above the $96.23 Fibonacci retracement, leaving the door open for $100,00.
US Crude Oil (WTI) Daily Chart
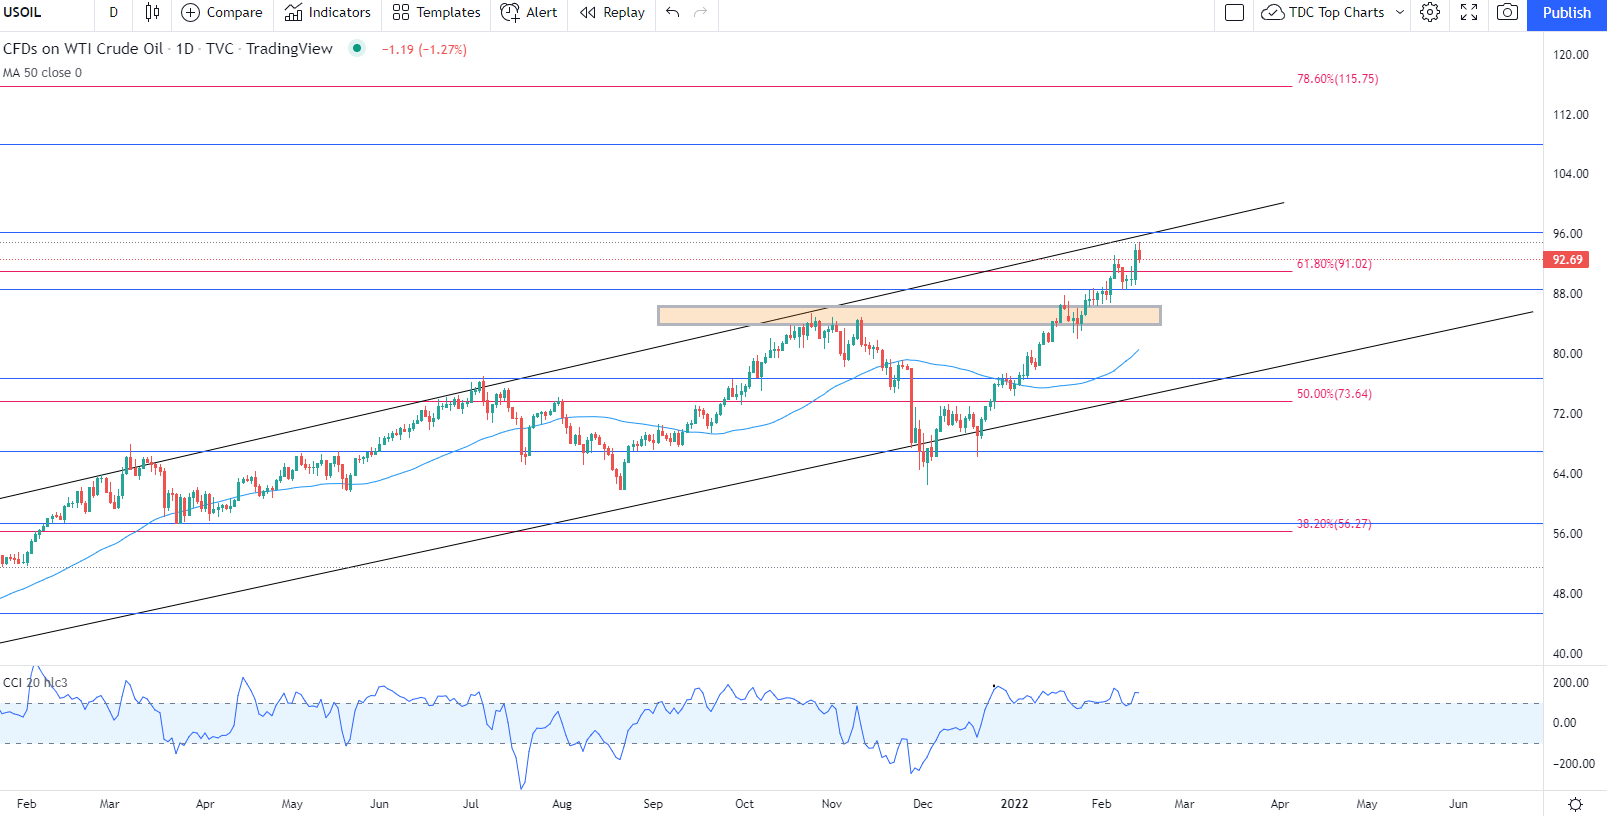
Chart prepared by Tammy Da Costa using TradingView
| Change in | Longs | Shorts | OI |
| Daily | -6% | 4% | -3% |
| Weekly | 15% | -25% | 0% |
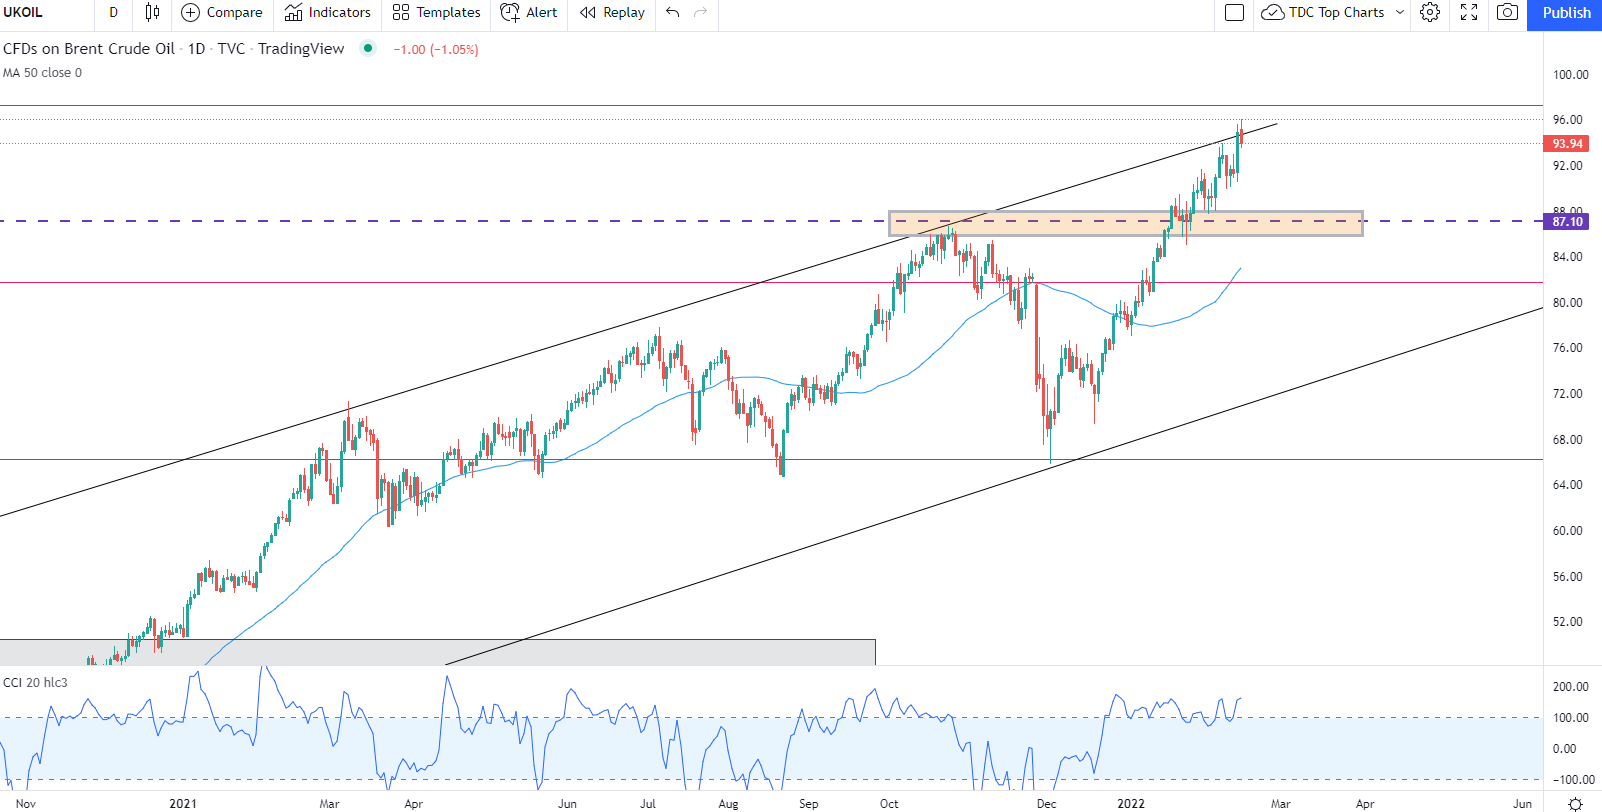
Similarly, Brent Crude has recently rebounded off of channel resistance, forcing prices back below $96.00 which remains as resistance for the imminent move.
While rising energy prices and geopolitical risks may continue to support rising prices, a shift in oil supply or the Russia-Ukraine narrative may pose as an additional catalyst for the imminent move.
UK (Brent) Oil Daily Chart
--- Written by Tammy Da Costa, Analyst for DailyFX.com
Contact and follow Tammy on Twitter: @Tams707


