


DOW JONES, NIKKEI 225 INDEX, CRUDE OIL, ASX 200 INDEX OUTLOOK:
- Dow Jones, S&P 500 and Nasdaq 100 indexes closed +1.06%, +0.84% and +1.21% respectively
- Growth optimism helps to alleviate concerns about interest rate hikes. Treasury yields extend higher
- Asia-Pacific equities look set to open higher, with investors eyeing Thursday’s CPI readings

Dow Jones, Inflation, Crude Oil, Treasuries, Asia-Pacific at Open:
The Dow Jones Industrial Average rebounded on Tuesday as investors shrugged off intensified bets on interest rate hikes by the Federal Reserve following a strong US nonfarm payrolls report. Robust job gains over the past three months, alongside strong, though uneven, earnings reports, suggest that the economy may be strong enough to withstand the steepest rate-hike cycle since 1980.
The implied probability of a 50bps rate hike at the March FOMC meeting has fallen to 28.8% from 33% two days ago, according to CME’s FedWatch tool. It suggests that market participants are slightly less convinced about a 50bps hike next months, lending support to risk assets. Meanwhile, yield on 10-year US Treasuries climbed to 1.965% - the highest since November 2019.
Amid a relatively quiet event calendar this week, investors will scrutinize Thursday’s US inflation figures for clues about rising price levels and their ramifications for the Fed’s tightening roadmap. Consensus forecasts indicate that CPI will hit 7.3% in January, the highest level in four decades. As inflation in the US gets more ‘entrenched’, the Fed is under increasing pressure to bring it back to the long-term target range. Many companies have highlighted rising wage pressures and labor shortages as some of the biggest headwinds they are facing.
CME FedWatch Tool – March Fed Meeting
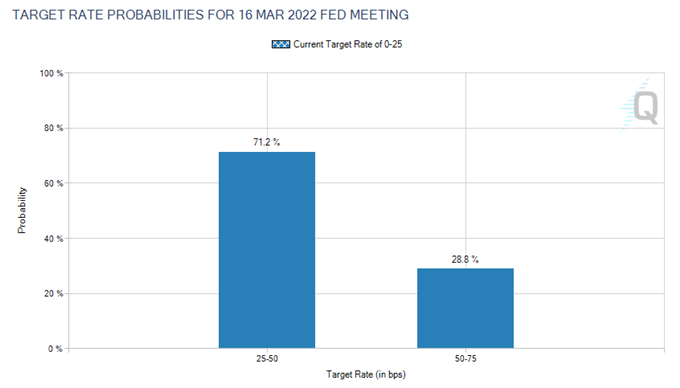
Source: CME
Crude oil prices fell 2% overnight as the resumption of US-Iran nuclear talks reignited hopes for the return of Iranian oil to the market, easing supply constraints. Energy was the worst-performing sector in Dow Jones overnight. Last week, OPEC+ committed to raise output by 400k bpd in March, which doesn’t seem to be sufficient to ease supply shortages as global economy gradually exits from the pandemic. The oil cartel is under increasing pressure from major consumers such as the US to pump more to rein in prices. As a result, any progress at the Iranian nuclear talks would likely dampen the prospect of crude oil prices and lead to a technical pullback.
Crude Oil Price - Daily
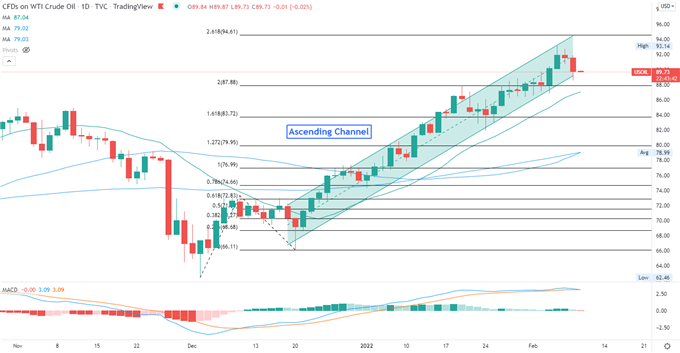
Chart created with TradingView
Asia-Pacific markets look set to open higher. Futures in Japan, Hong Kong, Australia, Taiwan, Singapore, Malaysia, India, Thailand and Indonesia are in the green. Those in mainland China and South Korea are in the red.
Mainland Chinese markets will be in focus today after news crossed the wires that state funds stepped into the stock market on Tuesday, bringing the Shanghai Composite index from deep losses to the positive territory. This may revitalize investor confidence, but also raise a question about the rally’s sustainability.
Looking back to Tuesday’s close, 6 out of 9 Dow Jones sectors ended higher, with 76.7% of the index’s constituents closing in the green. Healthcare (+2.82%), materials (+1.97%) and financials (+1.38%) were among the best performers, whereas energy (-1.52%) and communication services (-0.11%) lagged behind.
Dow Jones Sector Performance 08-02-2021
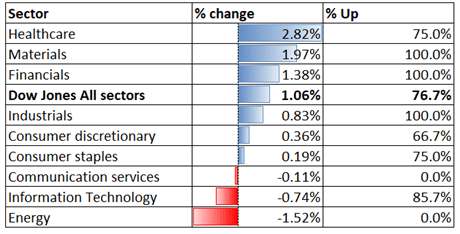
Source: Bloomberg, DailyFX
Dow Jones Index Technical Analysis
The Dow Jones Industrial Average rebounded from a key support level of 33,830 after the completion of a bearish “Butterfly” chart pattern. Prices are attempting to breach an immediate resistance level of 35,390 – the 50% Fibonacci retracement. A successful attempt may open the door for further gains with an eye on 36,215 and then 36,950. The MACD indicator has formed a bullish crossover and trended higher, underscoring upward momentum.
Dow JonesIndex – Daily Chart
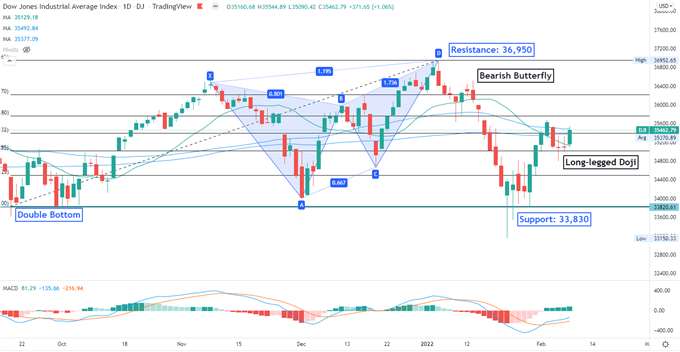
Chart created with TradingView
Nikkei 225 Technical Analysis:
The Nikkei 225 index breached below a “Symmetrical Triangle” pattern and thus opened the door for further downside potential. Prices have rebounded last week, but the overall trend remains bearish-biased. The lower trendline of the “Symmetrical Triangle” has now become immediate resistance. The MACD indicator formed a bullish crossover, suggesting that a technical rebound may be underway.
Nikkei 225Index – Daily Chart
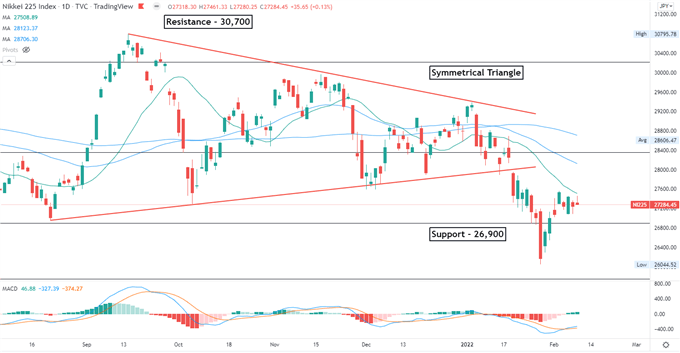
Chart created with TradingView
ASX 200 Index Technical Analysis:
The ASX 200 index is attempting to return to the range-bound zone between 7,200 and 7,500, riding a strong technical upswing. A successful attempt signals a bullish trend reversal and reveals the next resistance level of 7,340. The MACD indicator formed a bullish crossover beneath the neutral midpoint, suggesting that a technical rebound is underway.
ASX 200 Index – Daily Chart
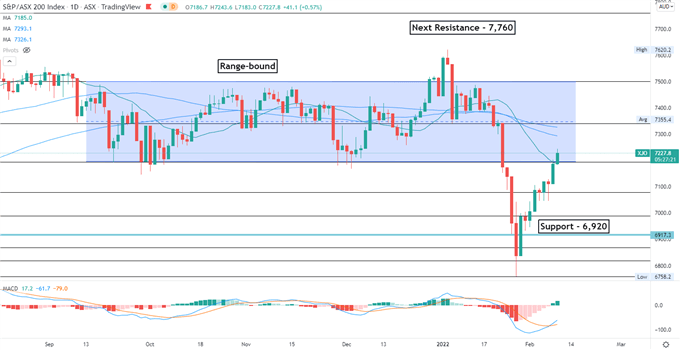
Chart created with TradingView

--- Written by Margaret Yang, Strategist for DailyFX.com
To contact Margaret, use the Comments section below or @margaretyjy on Twitter


