


Brent Crude Oil Talking Points and Analysis:
- US-Iran to resume talks – potential return of Iranian oil supply sends oil lower
- Brent crude oil drops from 7-year high as RSI confirmed oversold signal
- Key Brent crude oil technical levels analyzed

U.S.-Iran Nuclear Deal Talks Resume
The US and Iran resume talks in an attempt to find common ground surrounding the 2015 nuclear deal. US President Joe Biden has frequently communicated concern about escalating oil prices and its effect on inflation with very little co-operation from the organization of petroleum exporting countries (OPEC) and its allies. This resulted in the US President orchestrating the release of special petroleum reserves alongside the UK, China, India, Japan and Korea.
A successful resolution could see the return of Iranian oil into the market, which is likely to have the desired effect of lowering oil prices. Negotiators close to the talks said there was ‘progress’ towards reaching a deal which has lead prices lower this morning.
The persistently higher cost of oil has played a massive role in elevating headline measures of inflation. The UK’s latest inflation reading stands at 5.4%, which resulted in the Bank’s second rate hike since the pandemic. In the US, inflation data due later on Thursday is projected to soar to a brand new high of 7.3% as the Federal Reserve Bank readies itself for the possibility of its first rate hike in years.
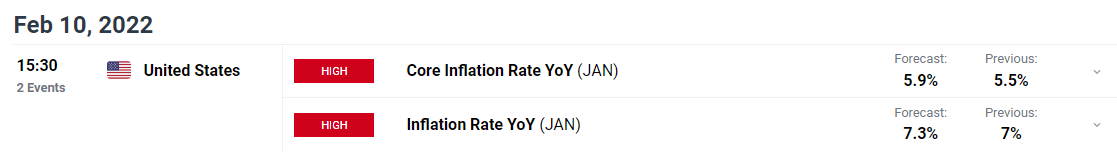
Customize and filter live economic data via our DaliyFX economic calendar
Brent Crude Oil Technical Levels
The monthly Brent crude oil chart reveals the impressive bull run since the April 2020 low that continues today. Key levels to the upside comprise of the 95.30 level (2012 support) and the psychological level of 100 dollars. More granular levels are analyzed on the daily chart to follow.
Crude Oil Monthly Chart
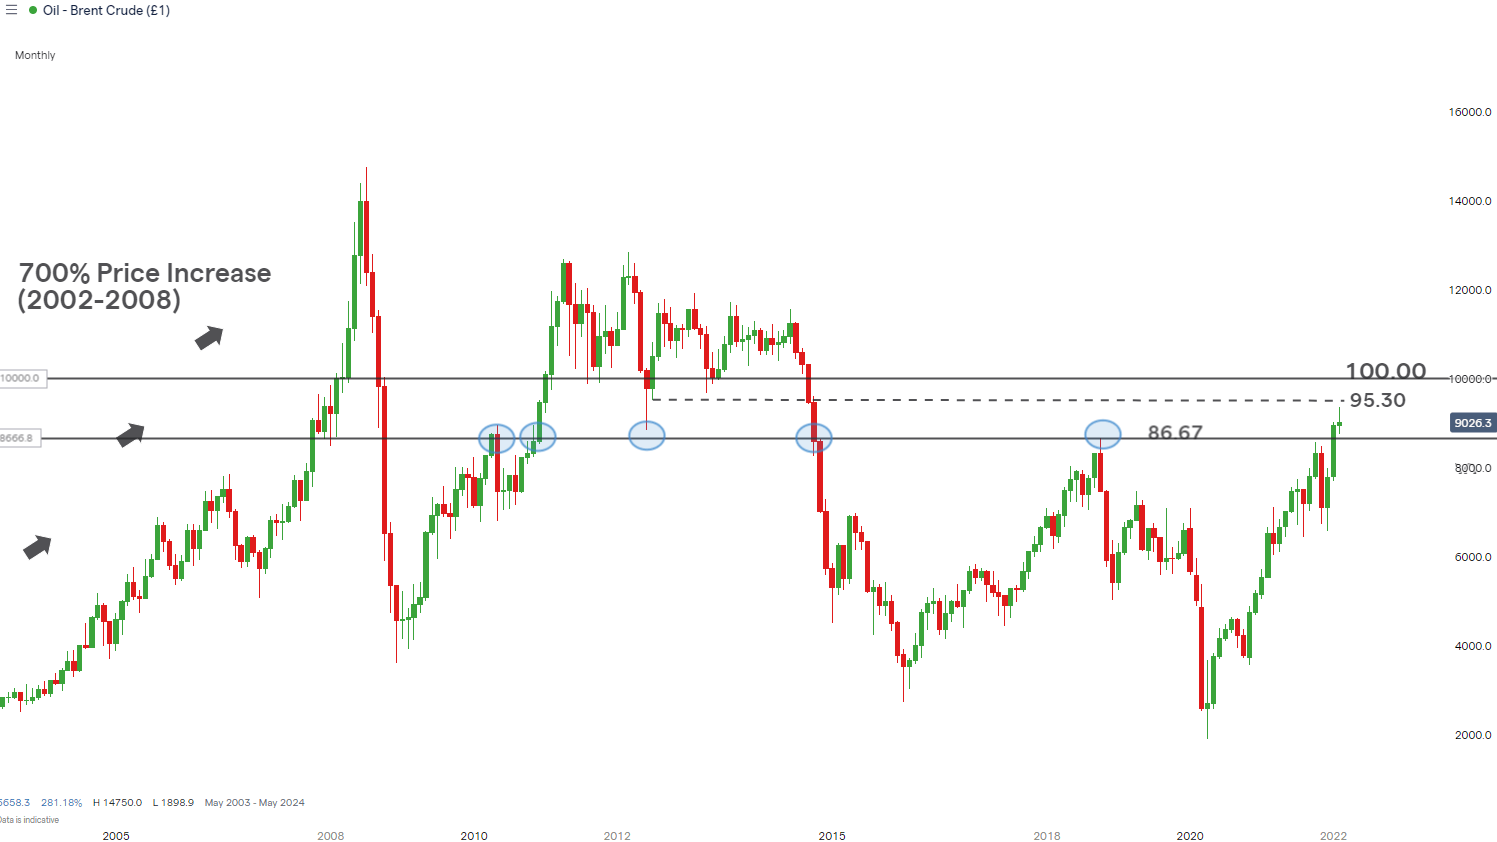
Source: IG, prepared by Richard Snow

The daily chart shows the recent high and subsequent pullback which appeared after shortly after entering overbought territory on the RSI. Due to the strength of the current bull trend, pullbacks have been rather shallow and short-lived. Therefore, even the 88.30 zone of resistance appears to be some distance away and would represent the largest pullback since the end of last year. On the upside, the nearest level of resistance appears at 9355 (recent high) and 95.30 before the significant 100 level.
Crude Oil Daily Chart
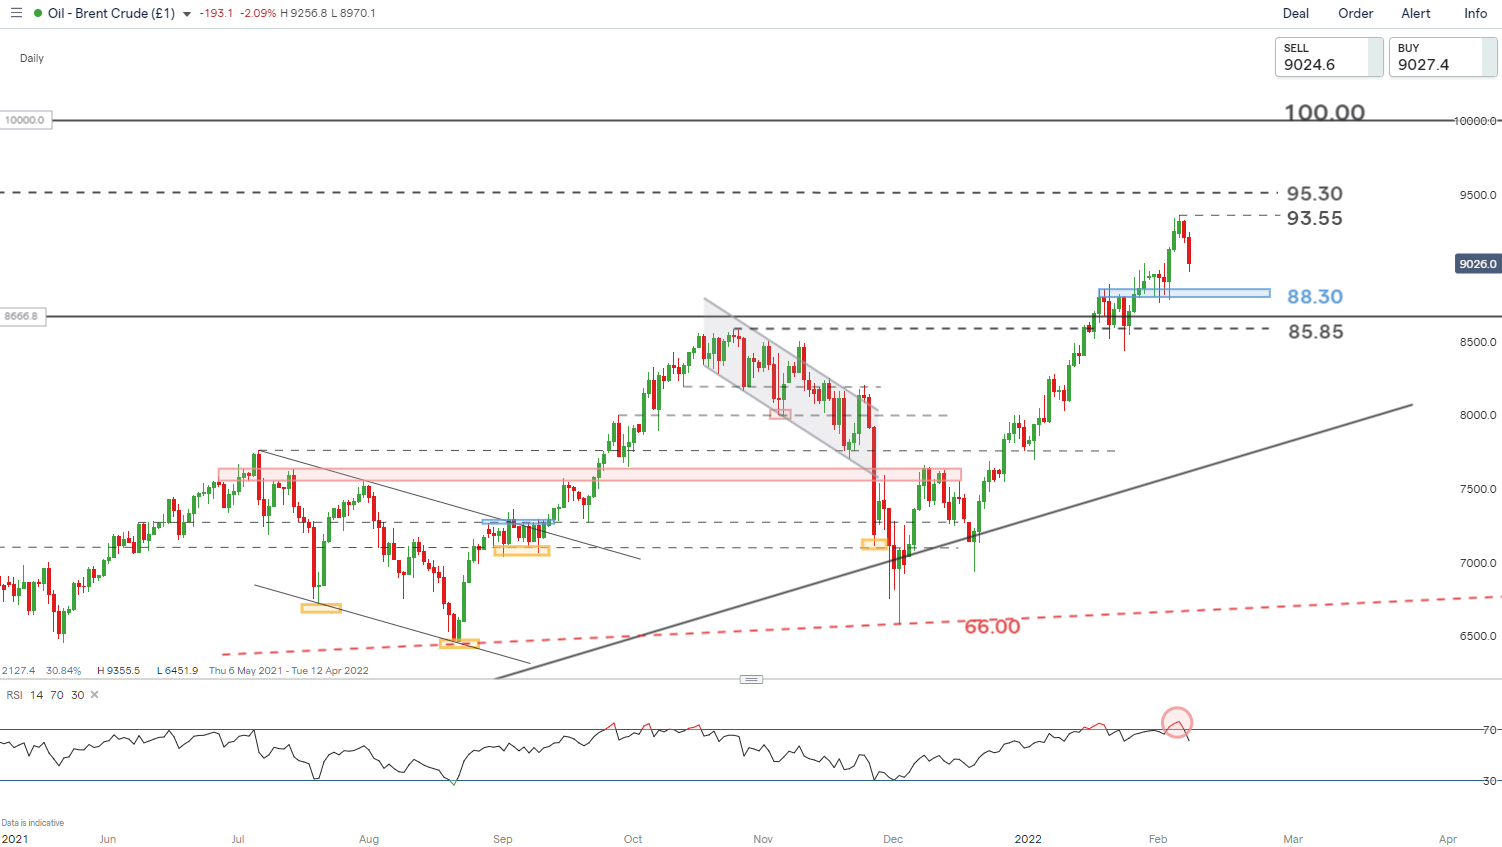
Source: IG, prepared by Richard Snow
The current bull trend, until proven otherwise, suggests that the notion of ‘buy the dip’ has transferred from equities to oil. Technicals and fundamentals continue to be skewed to the upside.
Trade Smarter - Sign up for the DailyFX Newsletter
Receive timely and compelling market commentary from the DailyFX team
--- Written by Richard Snow for DailyFX.com
Contact and follow Richard on Twitter: @RichardSnowFX


