Brent Crude Oil Analysis:
- Crude output Lower than Anticipated as OPEC+ Nations Wrestle with Capacity Constraints
- Recent oil price surge attributed to possible supply disruption due to conflict – OPEC+ delegates
- Brent crude oil: Key technical levels analysed


Output Lower than Anticipated as OPEC+ Nations Wrestle with Capacity Constraints
On Wednesday this week, OPEC+ held one of its briefest meetings where it was decided that the group would maintain its 400,000 bpd supply increase for March. However, the projected increases in output differ to actual observed levels of output as several OPEC members have struggled to meet current monthly targets and lack the capacity to expand output levels even further.
Saudi Arabia and a just a few others have spare capacity however, increasing output in this manner would remove the current buffer to any external shocks and remains unlikely for the time being.
Countries reported to have produced the same or lower levels of output include Congo, Iran, Angola, Libya and Iraq; due to unplanned outages or simply a lack of capacity. Iraq January output fell by 63,000 bpd compared to December owing to insufficient storage capacity.
OPEC + delegates attributed the recent surge in price to elevated concerns over the potential for supply disruption due to conflict rather than due to undersupply, although, geopolitical tensions were not even mentioned in the meeting.
Brent Crude Oil: Key Technical Levels
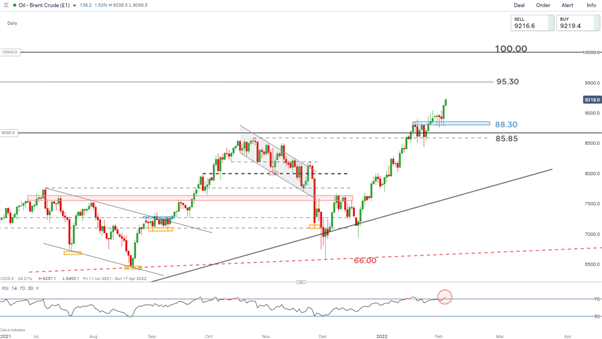
Crude oil prices have really accelerated after a period of temporary consolidation in mid to late January of this year. The 88.30 zone of resistance turned into a zone of support. Multiple long lower wicks, presented the first signs of a rejection of lower prices, setting the stage for the last 24 hour’s surge. Important to note that the commodity looks to be overbought (vis the RSI) at the moment and the possibility of a near-term pullback should not be overlooked.
A pullback and subsequent bounce off the 88.30 level could signal renewed bullish intent whereby the 95.30 level stands out as the next relevant level of resistance. In a market so heavily linked to fundamentals, if supply challenges resulting in less than anticipated OPEC+ supply continues to persist, the once ambitious target of $100 is not out of the question. A break below 85.85 would result in the need to reassess the current strong bullish bias.
Brent Crude Oil Daily Chart

Source: IG, prepared by Richard Snow


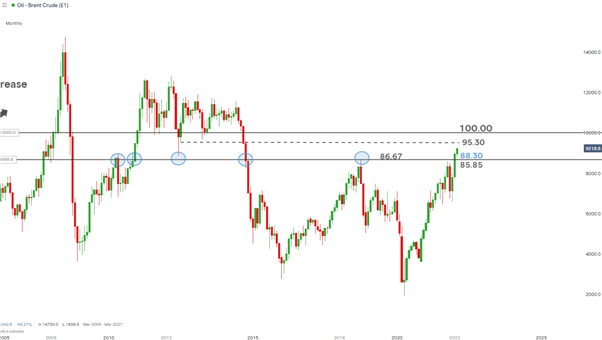
The monthly chart helps to frame recent crude prices within historical price ranges. Currently, prices trade well above the significant 86.67 level with 95.30 the next barrier to overcome.
Brent Crude Monthly Chart

Source: IG, prepared by Richard Snow
--- Written by Richard Snow for DailyFX.com
Contact and follow Richard on Twitter: @RichardSnowFX


