


DOW JONES, NIKKEI 225 INDEX, ASX 200 INDEX OUTLOOK:
- Dow Jones, S&P 500 and Nasdaq 100 indexes closed +0.63%, +0.94% and +0.80% respectively
- Alphabet climbed +7.5% whereas Facebook plunged -22% on Q4 results, underscoring an uneven earnings season
- Asia-Pacific equities look set to open mixed. China, Hong Kong and Taiwan markets remain closed for the CNY holiday

Dow Jones, Alphabet, Facebook, Asia-Pacific at Open:
The Dow Jones Industrial Average climbed for a fourth day on Wednesday as strong Alphabet earnings boosted market sentiment. Investors have probably also shrugged off the Fed’s tightening signal after last week’s FOMC meeting sent shockwaves to markets. Buyers appeared to have returned to the US market looking for bargain hunting opportunities amid the peak of the earnings season. We have observed an uneven pattern of reports, with some companies highlighting rising labor costs and supply chain challenges, whereas others have weathered the headwinds better. Looking ahead, Amazon will be the last FAANG company to report results after Thursday’s bell.
Alphabet has beaten on both the top and bottom lines for the fourth quarter. The company has also announced a 20-for-1 stock split. It registered a stellar revenue growth of 32% YoY, surpassing analysts’ forecasts. Its advertisement revenue surged 33% YoY to $61.24 billion, underscoring strong growth momentum amid a challenging environment. YouTube ad revenue was the only segment that fell short of market expectations however.
On the other hand, Facebook’s parent company Meta plunged more than 20% during after-hour trade after it announced weaker-than-expected earnings. Both its top and bottom line figures fell slightly short of consensus. Daily Active Users (DAUs) declined slightly during the fourth quarter, a sign that its momentum may have peaked. Facebook also projected lower revenue for the coming quarter, which is again below market expectations.
Futures of the Nasdaq 100 index plunged 2.3% during early APAC trade, wiping out Wednesday’s gains. This may set a sour tone for trading in the region. Mainland China, Hong Kong and Taiwan bourses remain closed for the Lunar New Year holiday, therefore trading might be quieter-than-usual.
Facebook - Daily
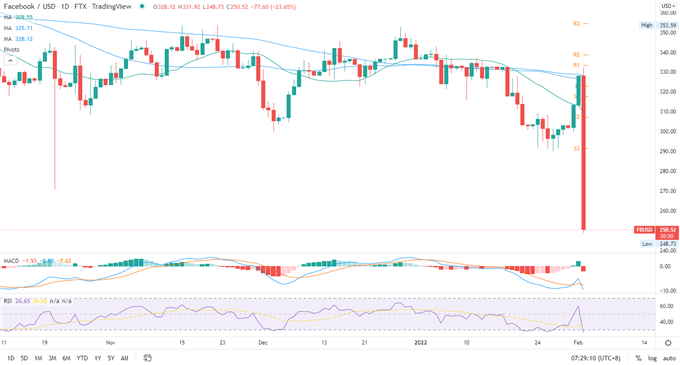
Chart created with TradingView
Futures in Japan, Australia, Singapore and Malaysia are in the red. Those in South Korea, Taiwan, India, Thailand and Indonesia are in the green.
Looking ahead, the BoE and ECB interest rate decisions dominate the economic docket alongside US ISM Non-Manufacturing PMI. Find out more from the DailyFX calendar.
Looking back to Wednesday’s close, 7 out of 9 Dow Jones sectors ended higher, with 70% of the index’s constituents closing in the green. Healthcare (+1.43%), consumer discretionary (+1.14%) and consumer staples (+0.99%) were among the best performers, whereas communication services (-0.64%) trailed behind.
Dow Jones Sector Performance 02-02-2021
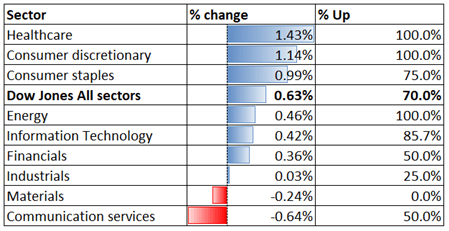
Source: Bloomberg, DailyFX
Dow Jones Index Technical Analysis
The Dow Jones Industrial Average rebounded from a key support level at 33,830 – the previous low seen in October.An immediate resistance level can be found at around 35,760 – the 61.8% Fibonacci retracement. The MACD indicator formed a bullish crossover and trended higher, underscoring upward momentum. The RSI oscillator rebounded from the oversold threshold, suggesting that a technical upswing is underway.
Dow JonesIndex – Daily Chart
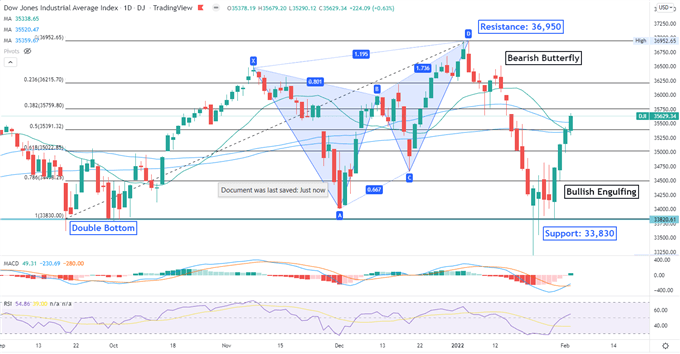
Chart created with TradingView
Nikkei 225 Technical Analysis:
The Nikkei 225 index breached below a “Symmetrical Triangle” pattern and thus opened the door for further losses. The lower trendline of the “Symmetrical Triangle” has now become an immediate resistance. The MACD indicator formed a bullish crossover beneath the neutral midpoint, suggesting that bearish momentum may be depleting.
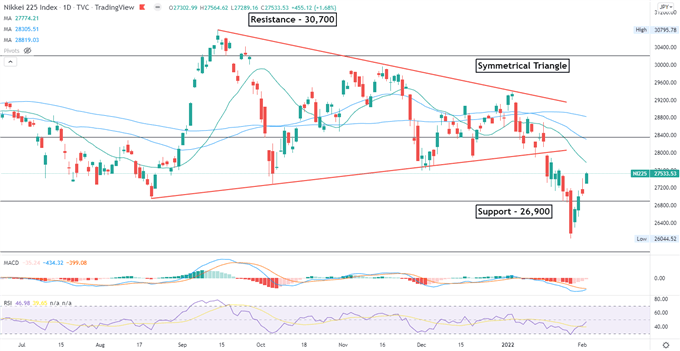
Chart created with TradingView
ASX 200 Index Technical Analysis:
The ASX 200 index breached below the floor of a range-bound zone between 7,200 to 7,500, exposing the next support level of 6,920 – the 61.8% Fibonacci extension. Prices are attempting for a technical rebound this week with an eye on 7,080 for resistance. The MACD indicator is about to form a bullish crossover, suggesting that selling pressure may be depleting.
ASX 200 Index – Daily Chart
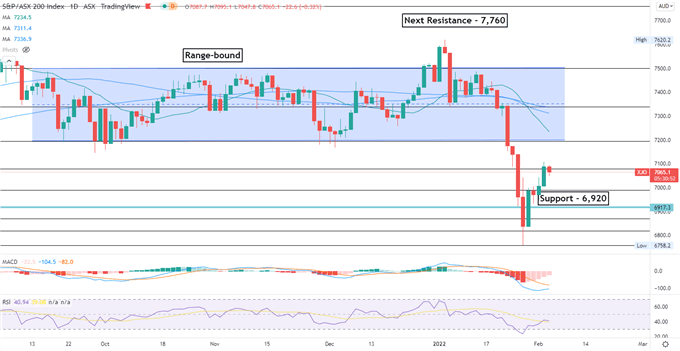
Chart created with TradingView

--- Written by Margaret Yang, Strategist for DailyFX.com
To contact Margaret, use the Comments section below or @margaretyjy on Twitter


