


VALUE STOCKS OUTLOOK:
- Value rotation could continue into 2022, but the thesisrests on the assumption that the recovery stabilizes after the omicron wave and the economy grows above trend
- Traders should follow the January nonfarm payrolls release, but exercise caution, as the report may give an inaccurate picture of the labor market (COVID may distort the data)
- In this article we present the most important technical levels for the Dow Jones Industrial Average
Trade Smarter - Sign up for the DailyFX Newsletter
Receive timely and compelling market commentary from the DailyFX team
Most read: Gold Price Forecast - Weak US Data, US Dollar Spurring Rebound, Levels for XAU/USD
In January, the Nasdaq 100 and technology stocks in general suffered significant losses, weighed down by rising Treasury yields as the Federal Reserve pressed ahead with its plans to dial back pandemic-era support to curb runaway inflation. Value stocks did not emerge unscathed from the rout, but their pullback was more limited as investors continued to pile on inexpensive companies with better fundamentals, stable cash flows and pricing power. As a result, the iShares Russell 1000 Value ETF (IWD) fell only 2.37% last month, much less than its counterpart the iShares Russell 1000 Growth ETF (IWF), which plunged 8.68%. In light of this divergence, investors and traders are wondering whether the value factor will continue to outperform in the coming months.
In general, value stocks do well in inflationary environments and when the central bank starts raising rates, but that's partly because lift-off usually coincides with solid economic growth and positive earnings prospects. Meanwhile, growth and tech firmsstruggle as higher rates depress the present value of their distant profits, while increasing their operating costs.
Until a few weeks ago, investors were confident that the U.S. economy would expand robustly and above trend in 2022, but that optimism is fading fast. For instance, first quarter GDP is expected to be flat or even contract slightly, following a 6.9% jump in the last three months of 2020. While economic activity weakness appears to be explained by the omicron outbreak and may therefore be transitory, many investors are not so sure, especially after the services sector nearly reached recessionary territory and private companies cut 301,000 jobs in January according to ADP.

Before making broad assumptions about overall conditions and the labor market, it is important to see what the national NFP report shows this Friday, but forecasts are not encouraging. Median expectations suggest employers added 150,000 workers last month, but many Wall Street firms anticipate a large decline in payrolls, including Goldman Sachs, which estimates a loss of 250,000 positions.
A temporary setback in hiring, which ultimately reverses in February and March, is unlikely to have a major negative impact on value stocks, but a sustained and pronounced slowdown may bring the ongoing rotation to a screeching halt. In fact, if the recession story begins to take hold, investors/traders are likely to start dumping value shares furiously, refocusing on growth and tech, as a downturn in the economy during an election year may prevent the Fed from being overly aggressive in terms of its hiking cycle. Should the recession narrative become ubiquitous on Wall Street, the Nasdaq 100 could shine again, outperforming the value-leaning indices such as the Dow Jones.
To better predict the path of the economy and the outlook for stocks, traders should continue to follow the earnings season (guidance), but especially incoming macro statistics. While it is a foregone conclusion that January data will disappoint, February and March results will be key and provide valuable insight into the health of the recovery.
| Change in | Longs | Shorts | OI |
| Daily | -26% | 26% | 2% |
| Weekly | -27% | 30% | 3% |
DOW JONES TECHNICAL CHART
After its early 2022 sell-off, the Dow Jones has begun to recover, rising more than 7% from its January low. Though the technical picture has improved after the index reclaimed its 200-day SMA last Friday, we need to see a decisive move above resistance at 36,700 to become convinced the worst is over and that a sustained rebound is in the making. If price manages to climb above this barrier, buying momentum could strengthen, paving the way for a move towards 36,200, followed by 36,600.
On the flip side, if the Dow is rejected from current levels and begins to cascade lower, support is seen near the 35,000 psychological level, where the 200-day simple moving average is sitting right now. If this floor is lost, traders should brace as the breakdown could invigorate selling activity and set the stage for a pullback towards the 34,000 area.
DOW JONES TECHNICAL CHART
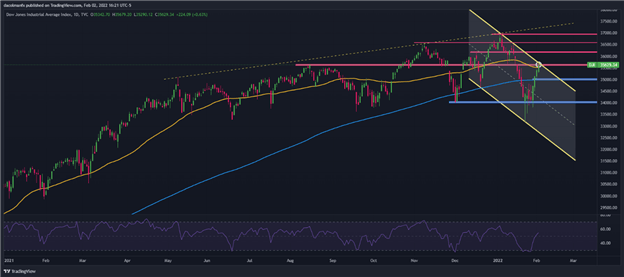
Dow Jones Chart prepared in TradingView
EDUCATION TOOLS FOR TRADERS
- Are you just getting started? Download the beginners’ guide for FX traders
- Would you like to know more about your trading personality? Take the DailyFX quiz and find out
- IG's client positioning data provides valuable information on market sentiment. Get your free guide on how to use this powerful trading indicator here.
---Written by Diego Colman, Contributor


