


AUD/USD Price, Chart, and Analysis
- AUD/USD testing psychological and multi-moth support.
- RBA monetary policy meeting next week.

The Australian dollar continues to weaken against a powerful US dollar with AUD/USD now pressing down on a notable multi-month support level. This level, either side of 0.7000, has held three tests over the past 15-months but is now looking vulnerable against a strong greenback. The US dollar has been moving higher since November last year and it continues to push higher, given extra strength by this week’s hawkish FOMC meeting.
Next week sees the Australian central bank announce its latest monetary policy update. The meeting on February 1 is expected to see the base rate left unchanged and is also likely to see the RBA discuss tapering their asset purchase program from its current level of AUD 4bn a month. Any taper would signal to the market that monetary policy tightening is starting and may give the Australian dollar a bid.
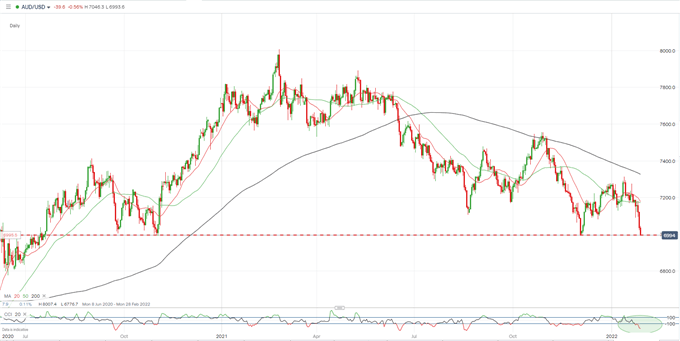
The daily chart shows the 0.7000 level under pressure with little in the way of support until a cluster of prior lows all the way down to below 0.6800 come into play. These trades are all happened around mid-2020 and may not hold a great deal of conviction. The chart does show the pair heavily in oversold territory (CCI indicator at the bottom of the chart) and this may temper any move lower in the short term.
AUD/USD Daily Price Chart January 28, 2022
Retail trader data show 67.84% of traders are net-long with the ratio of traders long to short at 2.11 to 1. The number of traders net-long is 13.62% higher than yesterday and 16.33% higher from last week, while the number of traders net-short is 14.67% lower than yesterday and 8.83% lower from last week.
We typically take a contrarian view to crowd sentiment, and the fact traders are net-long suggests AUD/USD prices may continue to fall. Traders are further net-long than yesterday and last week, and the combination of current sentiment and recent changes gives us a stronger AUD/USD-bearish contrarian trading bias.
| Change in | Longs | Shorts | OI |
| Daily | -8% | -4% | -7% |
| Weekly | -3% | 49% | 4% |
What is your view on the AUD/USD– bullish or bearish?? You can let us know via the form at the end of this piece or you can contact the author via Twitter @nickcawley1.


