


S&P 500, Microsoft, Federal Reserve, Treasury Yields – Talking Points
- S&P 500 comeback falls short of positive territory, closes down 1.2%
- Microsoft earnings beat estimates, shares plummet 4% after-hours
- Markets turn to Wednesday’s FOMC meeting for near-term path

The S&P 500 failed to replicate Monday’s miraculous recovery from red to green, with Tuesday’s afternoon reversal falling just short of positive territory. The index ultimately closed down by roughly 1.2%, after sharp declines in the final hour of trading. Energy was the best of a bad bunch on Tuesday, fueled by WTI rising to over $85/bbl. Banks also fared well as Treasury yields rose across the curve. The 2-year Treasury yield climbed back above 1% in anticipation of Wednesday’s FOMC meeting.
S&P 500 Futures 1 Hour Chart
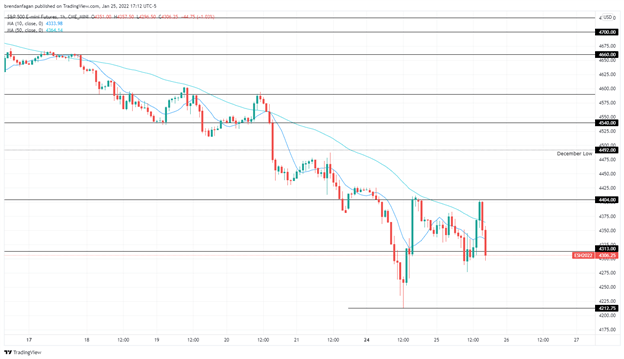
Chart created with TradingView
Despite the intraday rally, the S&P 500 was unable to cling onto gains. E-mini S&P 500 futures (ES) found resistance yet again at 4,404, a level that also proved sticky in Monday’s session. The rejection from this level saw a swift and powerful decline in the final hour of trade, with said decline extending into the after-hours session. Post market declines were driven by Microsoft, which fell sharply despite posting strong quarterly results. Price immediately fell to support around 4,313, another prime example of the volatility of the last few sessions.
Microsoft Earnings Summary:
- Revenue: $51.7B vs. $50.872B est.
- EPS: $2.48 vs. $2.31 est.
Microsoft 5 Minute Chart
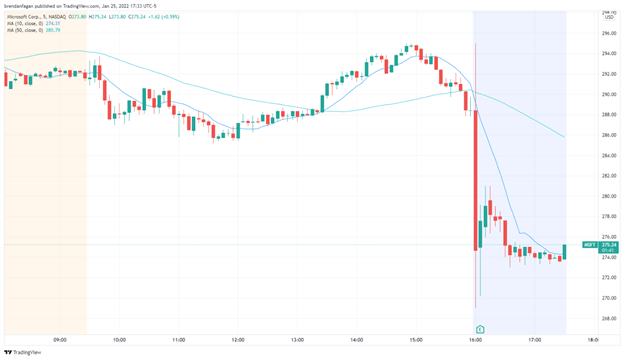
Chart created with TradingView
Markets remain on edge ahead of Wednesday’s FOMC meeting, and rightly so. Markets have been quick to price in a hawkish Fed, with the baseline case including 4 rate hikes and balance sheet normalization in 2022. Slowing economic data could pave a path for the Fed to come across more dovish, potentially offering some respite for beaten down risk assets.
The nature of price action late Tuesday could paint an ominous picture for Wednesday, with price falling closer to the Monday low of 4,412.75. Should price breach these lows, more pain could be ahead. There is plenty of clean air below this week’s low, and price could even look to close a gap that remains from last March below 4,020. While trading down to roughly 4,000 may seem unconceivable to many, the gap fill constitutes just a 6.6% decline from current levels.
Trade Smarter - Sign up for the DailyFX Newsletter
Receive timely and compelling market commentary from the DailyFX team
Resources for Forex Traders
Whether you are a new or experienced trader, we have several resources available to help you; indicator for tracking trader sentiment, quarterly trading forecasts, analytical and educational webinars held daily, trading guides to help you improve trading performance, and one specifically for those who are new to forex.
--- Written by Brendan Fagan, Intern
To contact Brendan, use the comments section below or @BrendanFaganFX on Twitter


