


GBP/USD Price, Chart, and Analysis
- UK headline inflation hits 5.4%.
- Sterling underpinned by the latest data.

Keep up to date with all market-moving data releases and events by using the DailyFX Calendar
UK price pressures continue to soar with annual inflation rising to 5.4% in December from 5.1% in November while the core inflation rate y/y rose to 4.2% from a prior reading of 4.0%. Both readings beat market expectations.

One of the Bank of England’s favoured inflation readings, the consumer price index including owner occupier’s housing costs (CPIH) rose by 4.8% in the 12 months to December 2021, up from 4.6% to November. According to the Office for National Statistics (ONS), ‘The 12-month inflation rate was the highest since September 2008, when it also stood at 4.8%. This is the highest recorded 12-month inflation rate in the National Statistics data series, which begins in January 2006, and the highest rate since CPIH stood at 5.1% in May 1992 in the historical modelled estimates.’ Food prices grew strongly, along with increases in furniture and clothing, while petrol prices were stable this month.
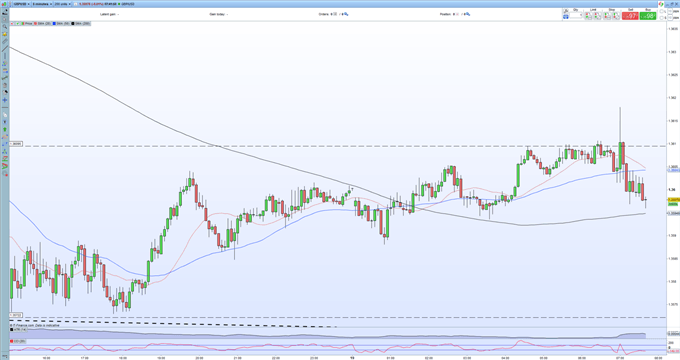
Sterling nudged higher on the release but soon gave back its modest gains. GBP/USD touched 1.3618 before drifting back to 1.3600, around 10 cents below the 07:00 GMT release level. While Sterling is being underpinned by strong UK data – the UK unemployment rate fell to 4.1% yesterday - GBP/USD remains under the spell of the US dollar which continues to strengthen ahead of next week’s FOMC meeting.
GBPUSD 5 Minute Price Chart January 19, 2022
Retail trader data 47.27% of traders are net-long with the ratio of traders short to long at 1.12 to 1. The number of traders net-long is 7.23% higher than yesterday and 8.78% higher from last week, while the number of traders net-short is 12.65% lower than yesterday and 5.70% lower from last week.
We typically take a contrarian view to crowd sentiment, and the fact traders are net-short suggests GBP/USD prices may continue to rise. Yet traders are less net-short than yesterday and compared with last week. Recent changes in sentiment warn that the current GBP/USD price trend may soon reverse lower despite the fact traders remain net-short.
| Change in | Longs | Shorts | OI |
| Daily | -14% | -3% | -10% |
| Weekly | -18% | 18% | -6% |
What is your view on GBP/USD – bullish or bearish?? You can let us know via the form at the end of this piece or you can contact the author via Twitter @nickcawley1.


