


Gold Price (XAU/USD), Chart, and Analysis
- Gold eyes overhead resistance.
- US dollar weakens despite supportive US Treasury yields.
How to Manage the Emotions of Trading
Gold is pushing back towards noted resistance between $1,830/oz. and $1,836/oz. despite four-decade high US inflation. The precious metal is benefitting from a bout of weakness in the US dollar as traders unwind their aggressive bets on the greenback. The US dollar has been a one-way trade leading up into this year with bulls controlling price action, supported by an increasingly hawkish Federal Reserve. With the Fed’s thoughts now clear for all to see, some US dollar bets are being unwound despite still supportive US Treasury yields. The interest-rate sensitive is currently quoted around 0.92%, up from around 0.20% just four months ago, while the benchmark 10-year is quoted at 1.75%. Despite the current bout of US dollar weakness, these Treasury yields will underpin the greenback moving forward, weighing on the price of the precious metal.

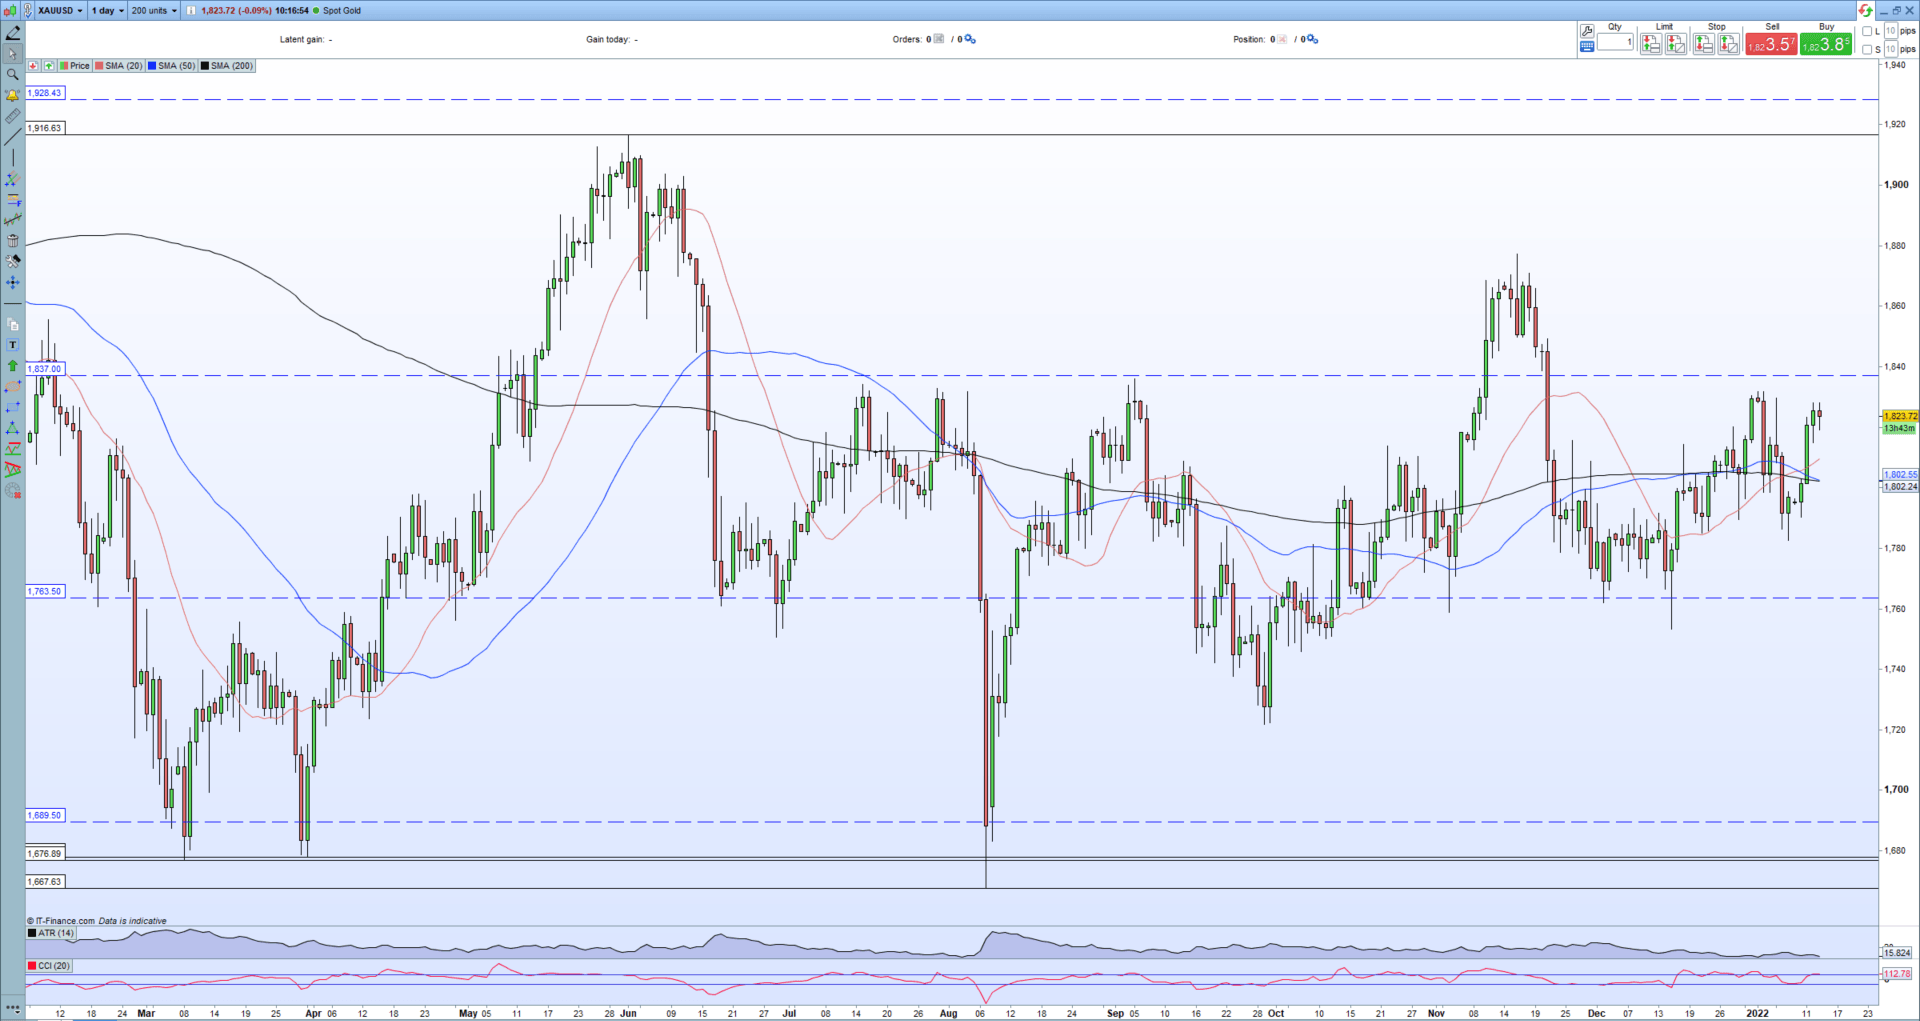
Gold has been trading in a fairly well-defined range since mid-November with a couple of false support breaks pulled back sharply. The precious metal has been drifting higher over recent weeks although an area of resistance between $1,830/oz. and $1,836/oz. has held recent attempts. Gold is likely to make another attempt to break higher, and if successful the precious metal would then target the mid-November high at $1,877/oz. The moving average set-up is mixed and the CCI indicator highlights that gold is becoming overbought, suggesting that a confirmed break above resistance may prove to be difficult.
Gold (XAU/USD) Daily Price January 13, 2022
Retail trader data show64.23% of traders are net-long with the ratio of traders long to short at 1.80 to 1. The number of traders net-long is 1.45% lower than yesterday and 4.69% lower from last week, while the number of traders net-short is 0.10% higher than yesterday and 30.70% higher from last week.
We typically take a contrarian view to crowd sentiment, and the fact traders are net-long suggests Gold prices may continue to fall.Yet traders are less net-long than yesterday and compared with last week. Recent changes in sentiment warn that the current Gold price trend may soon reverse higher despite the fact traders remain net-long.

What is your view on Gold – bullish or bearish?? You can let us know via the form at the end of this piece or you can contact the author via Twitter @nickcawley1.


