


GOLD ANALYSIS
- Omicron concerns fading.
- Trendline resistance being tested.
- IG client sentiment bearish.
BULLION FUNDAMENTAL BACKDROP
With higher vaccine efficacy shown by the Johnson & Johnson offering, the seriousness of the Omicron variant has dissipated and sentiment shifting to a more risk seeking approach this New Years Eve. The allure of spot gold as a safe-haven asset should follow suit however the weaker dollar (during the festive period) as outlined in my previous gold forecast, has been sustaining elevated gold prices.
The inflation factor adds an additional layer of sustenance for further upside along with real rates currently in negative territory (see graphic below). Real yields compare the effects of inflation on yields which in this case are greater than yields thus resulting in a negative reading. An increasing real yield increases the opportunity cost of holding gold and with U.S. 10-year yields set to hit 2% in 2022 along with transitory inflation (and of course higher interest rates), gold may be in for a downhill battle.
TREASURY REAL YIELD CURVE RATES 5,10-YEAR:
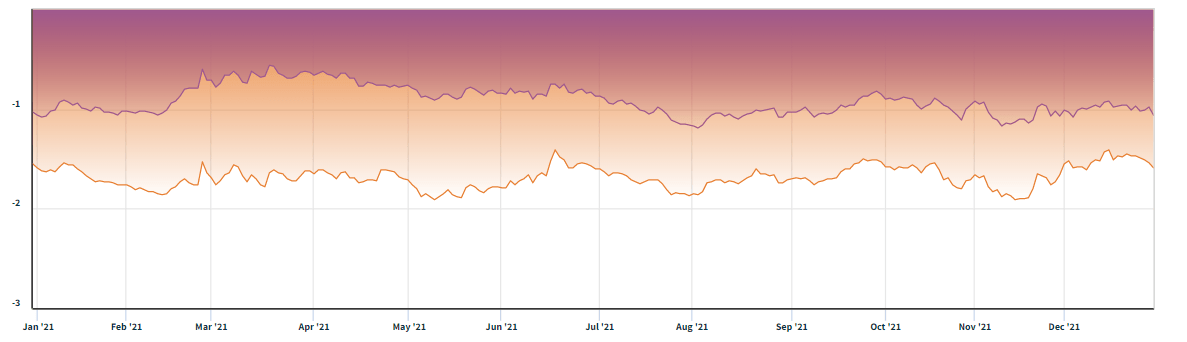
Source: Nasdaq Data Link
GOLD ECONOMIC CALENDAR
Next week we have a lot to look forward to with several high impact dollar related announcements to kick of 2022. PMI is in focus on Monday and Tuesday with both data providers forecasting lower prints but still remain above the 50 threshold. Any significant deviation could result in large dollar price swings and consequently gold.
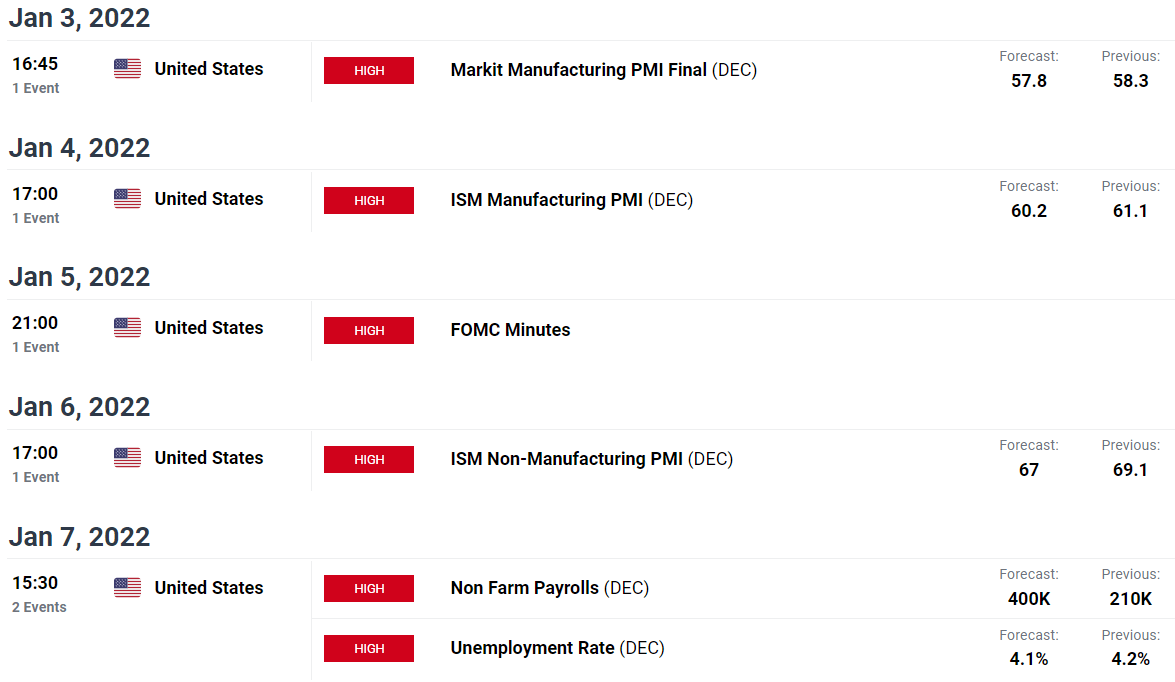
Source: DailyFX Economic Calendar
TECHNICAL ANALYSIS
GOLD PRICE DAILY CHART
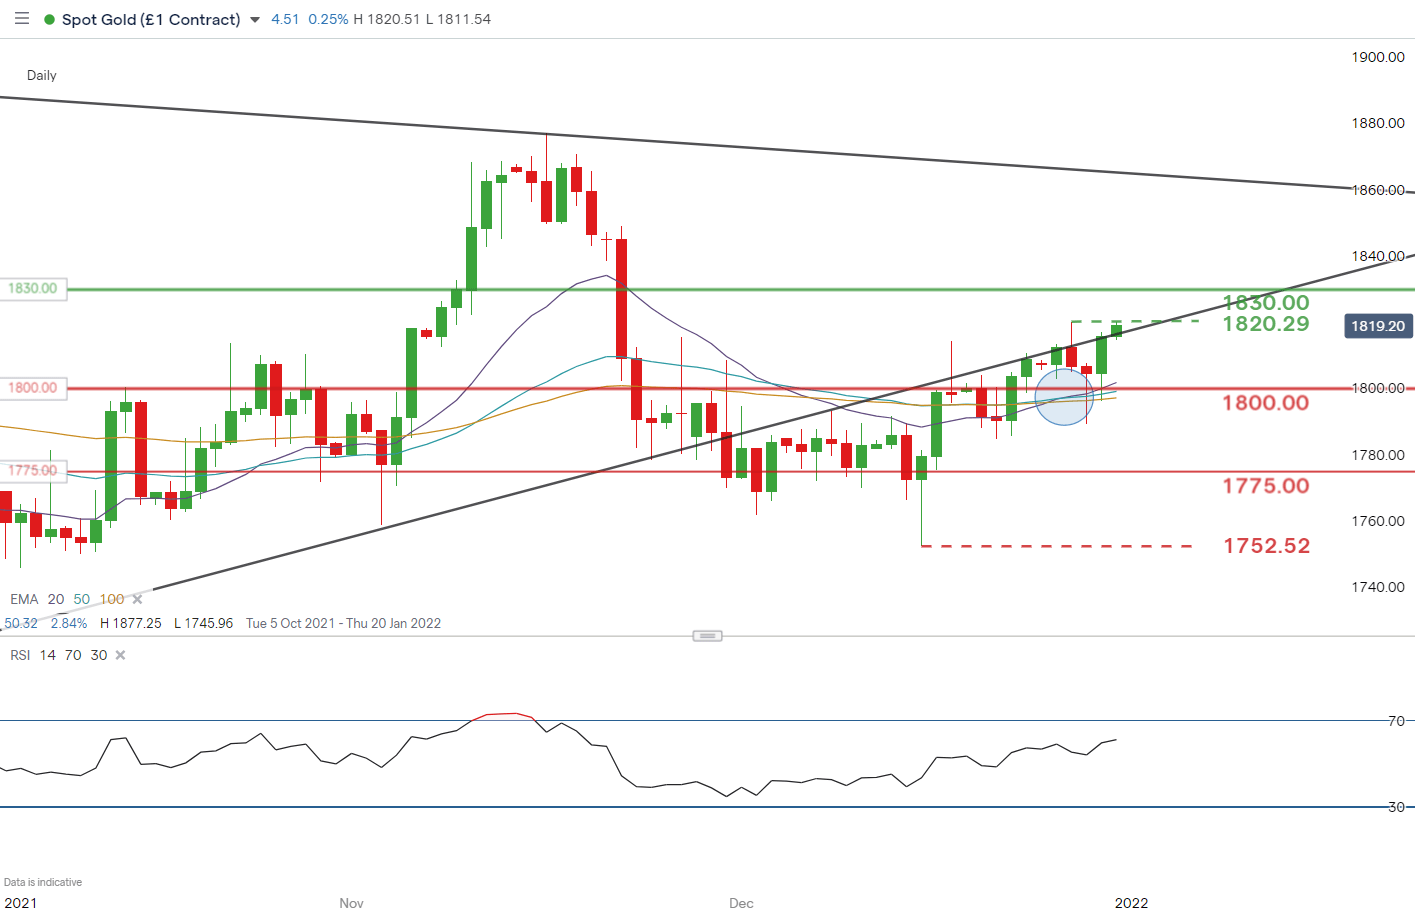
Chart prepared by Warren Venketas, IG
Gold is once again testing the lower bound of the prior symmetrical triangle (black), now trendline resistance. Prior to this, bulls were unable to close above resistance as evident by the several long upper wicks since late November.
Currently, gold bulls are eyeing Tuesdays swing high at 1820.29 with scope for 1830.00 highly likely short-term. As mentioned earlier this week, this could be the last push to the upside before gold’s fundamental forecast kicks in.
The EMA bullish crossover (blue) has now revealed itself with the 20-day EMA (purple) crossing above the 50-day EMA (blue), yet another short-term bullish signal.

Resistance levels:
- 1830.00
- 1820.29
Support levels:
- 1800.00
- 1775.00
- 1752.52
IG CLIENT SENTIMENT DATA POINTS TO SHORT-TERM DOWNSIDE
IGCS shows retail traders are currently distinctly short on spotgold, with 74% of traders currently holding long positions (as of this writing). At DailyFX we typically take a contrarian view to crowd sentiment and the fact traders are net-long is suggestive of a short-term bearish inclination.
| Change in | Longs | Shorts | OI |
| Daily | 3% | -2% | 0% |
| Weekly | 8% | -8% | 0% |
Contact and follow Warren on Twitter: @WVenketas


