


GOLD ANALYSIS
- Rising Omicron cases supportive of higher gold prices.
- Inflationary pressure set to extend over festive period.
- Key daily levels in focus.
- IG client sentiment mixed but majority remains long.
BULLION FUNDAMENTAL BACKDROP
With room for inflation to continue its consistent rise on the back of festive buying pressures and constricted supply chain bottlenecks, spot gold could see another move higher before the hawkish tilt from most major central banks weigh negatively on the yellow metal next year. The 5-year breakeven rate (see chart below) reflects the aforementioned inflation expectations which traditionally maintains a positive correlation with spot gold prices.
5-YEAR BREAKEVEN INFLATION RATE:
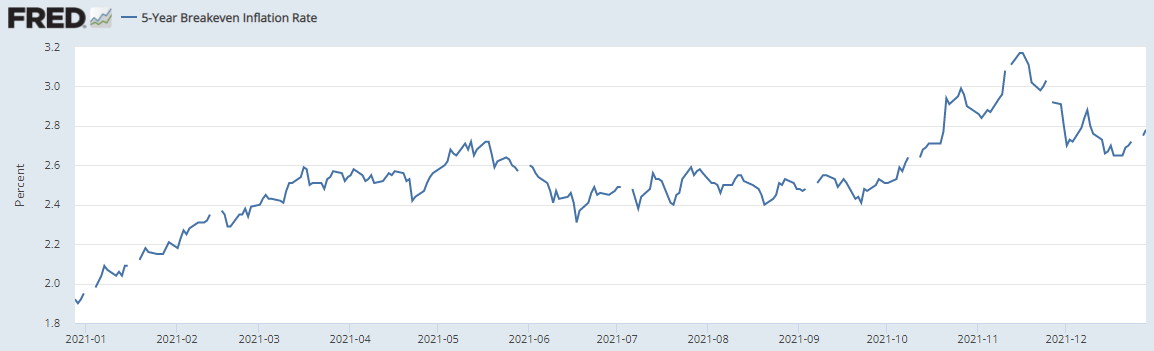
Source: FRED
The increase in recent new COVID-19 cases (see graphic below) has provided additional support for this short-term bullish outlook and aligns itself with gold’s safe-haven appeal. The systemic nature (widespread increase across the globe) of this risk should be more beneficial for gold as opposed to more isolated country/regional risk as we saw earlier this year in Europe.
NEW GLOBAL COVID-19 CASES:
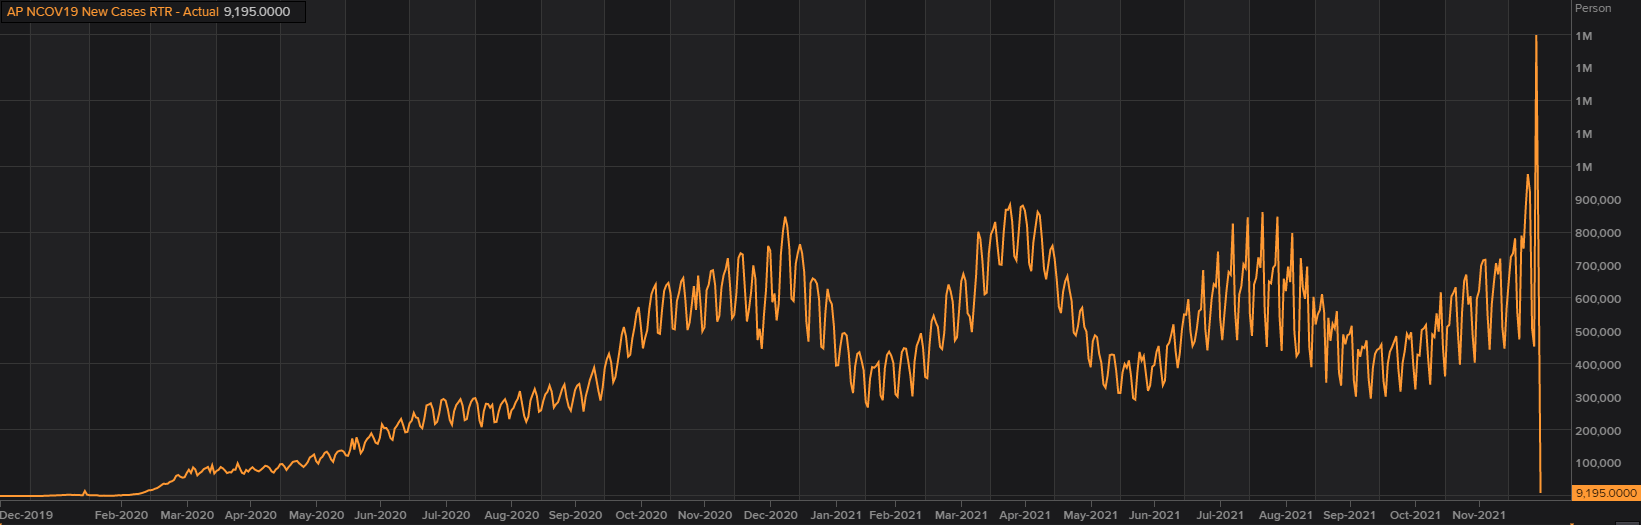
Source: Refinitiv
Real yields have flattened of recent diminishing the opportunity cost factor of holding gold and further reiterating the combating nature of rising inflation against yields.
TREASURY REAL YIELD CURVE RATES 5,10-YEAR:
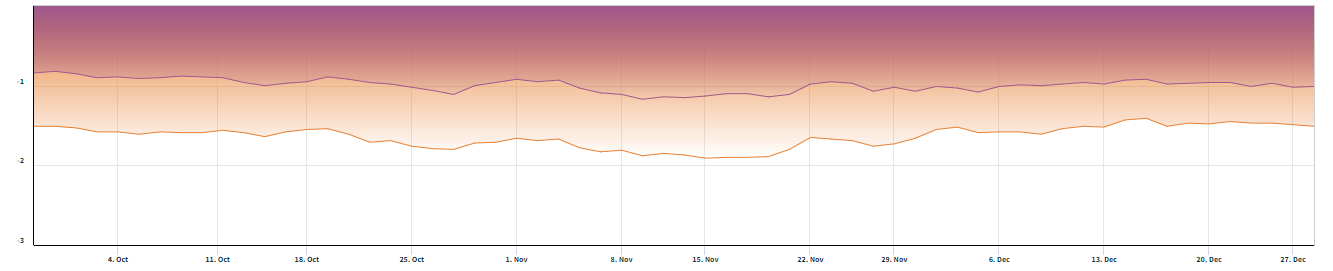
Source: Nasdaq Data Link
TECHNICAL ANALYSIS
GOLD PRICE DAILY CHART
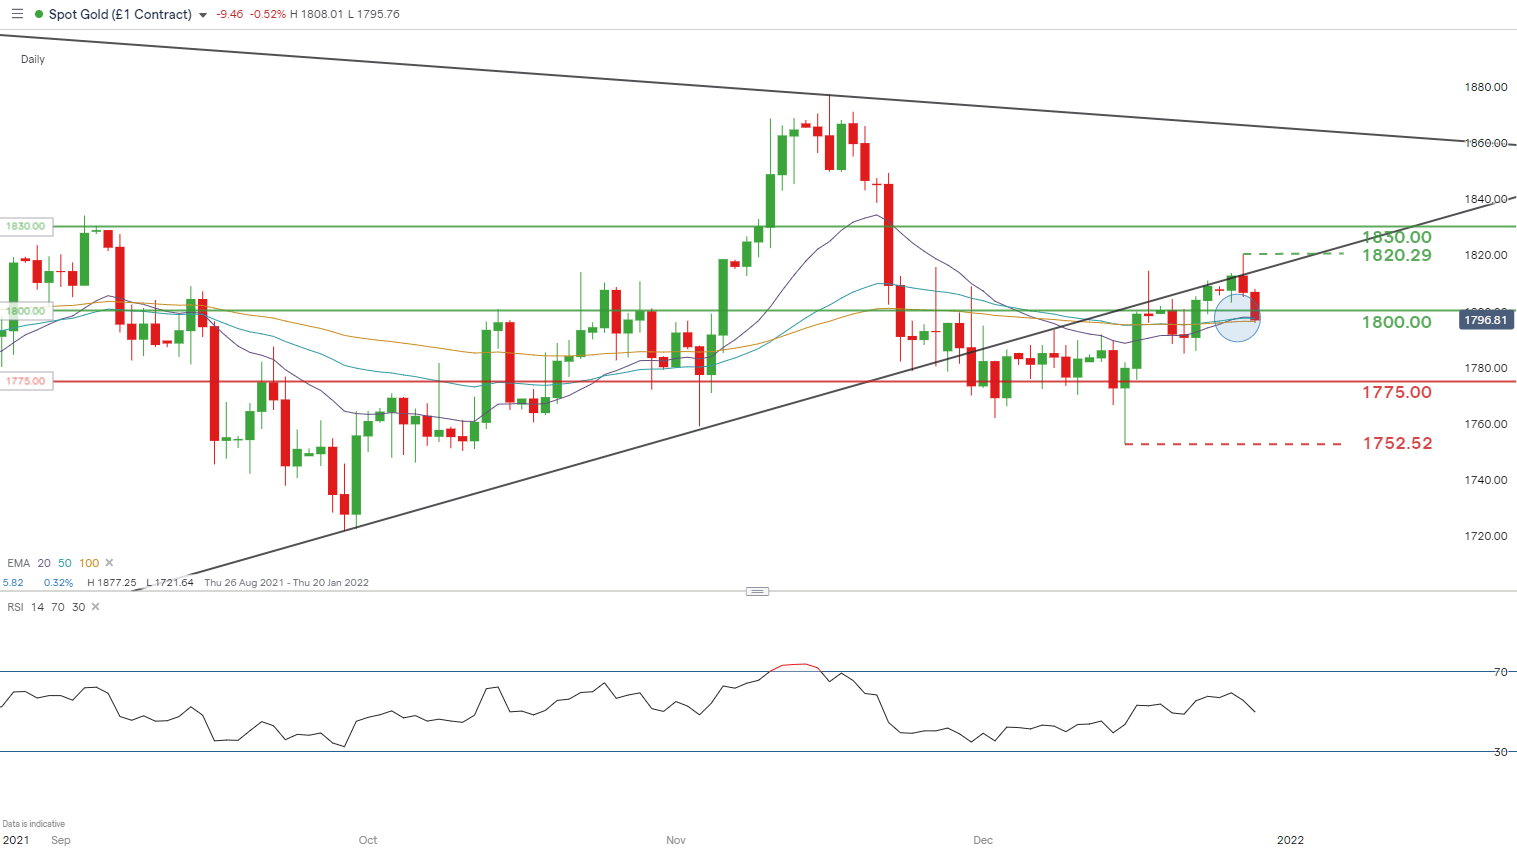
Chart prepared by Warren Venketas, IG
Since the symmetrical triangle (black) at the end of November, gold bulls have been unable to penetrate and close above triangle support. This has been mostly due to a strong dollar outlook. Today is no different with the dollar index (DXY) up roughly 0.2% on the day. A candle close below the psychological 1800.00 level and the cluster of EMA indicators could prompt further selling towards consequent support zones.
From a bullish perspective, the EMA area of confluence where gold is poised at present may see bulls re-enter causing a close above 1800.00. A bullish crossover (blue) may be unfolding reflected by the 20-day EMA (purple) crossing above the 50-day EMA (blue), and the close of trade today should give some short-term directional bias.

Resistance levels:
- 1830.00
- 1820.29
- 1800.00
Support levels:
- 1775.00
- 1752.52
IG CLIENT SENTIMENT DATA INDICATES SHORT-TERM HESITANCY
IGCS shows retail traders are currently distinctly short on spotgold, with 78% of traders currently holding long positions (as of this writing). At DailyFX we typically take a contrarian view to crowd sentiment and the fact traders are net-long is suggestive of a short-term bearish inclination however recent changes in longs and shorts reflect a mixed disposition.
| Change in | Longs | Shorts | OI |
| Daily | 6% | -11% | -3% |
| Weekly | 3% | -12% | -4% |
Contact and follow Warren on Twitter: @WVenketas


