


GBP/USD Price, Chart, and Analysis
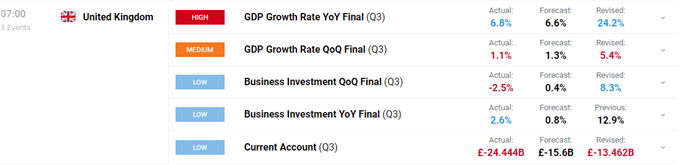
- Mixed UK Q3 GDP data lends Sterling a small bid.
- Market liquidity continues to thin ahead of the holiday period.

The UK economy grew by 1.1% between July and September this year, missing prior forecasts of 1.3% growth. The annualized rate however beta prior forecasts – 6.8% compared to 6.6% - due to an upward revision in the 2020 numbers. The latest data shows the UK economy is now 1.5% below where it was pre-coronavirus at Q4 2019, revised from the previous estimate of 2.1% below. A mixed to a slightly positive set of numbers although the effects of the current Omicron variant will not be seen until Q4 data is released.
Keep up to date with all market-moving data releases and events by using the DailyFX Calendar
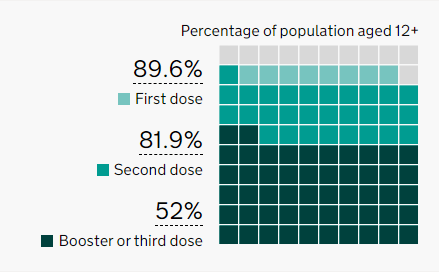
The latest UK Omicron data show the covid-variant spreading at a rapid pace with over 615k people testing positive in the last seven days. On a slightly more positive note, patients admitted to hospital are starting to flatline and remain well below levels seen in previous covid-19 outbreaks. The number of people who have received a third vaccination continues to climb with just under 900k doses administered in the latest data release.
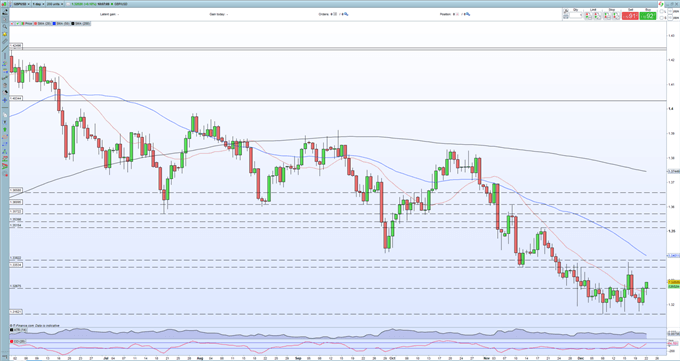
GBP/USD is trading slightly higher in early European turnover with the pair currently around 1.3285. Cable has been building a base of the 1.3160 area in the last two weeks and this level looks likely to remain supportive in the short term. The US dollar remains firm and looks set to move higher over the coming weeks and months, limiting the pair’s upside, with short-term resistance seen around 1.3350-1.3380. A confirmed break higher brings 1.3515 into play.
GBP/USD Daily Price Chart – December 22, 2021
Retail trader data show 74.61% of traders are net-long with the ratio of traders long to short at 2.94 to 1. The number of traders net-long is 6.16% lower than yesterday and 0.61% lower from last week, while the number of traders net-short is 17.35% higher than yesterday and 9.74% lower from last week.
We typically take a contrarian view to crowd sentiment, and the fact traders are net-long suggests GBP/USD prices may continue to fall.Positioning is less net-long than yesterday but more net-long from last week. The combination of current sentiment and recent changes gives us a further mixed GBP/USD trading bias.
| Change in | Longs | Shorts | OI |
| Daily | 0% | 0% | 0% |
| Weekly | 3% | 5% | 4% |
What is your view on GBP/USD – bullish or bearish?? You can let us know via the form at the end of this piece or you can contact the author via Twitter @nickcawley1.


