


Gold Price, Chart, and Analysis
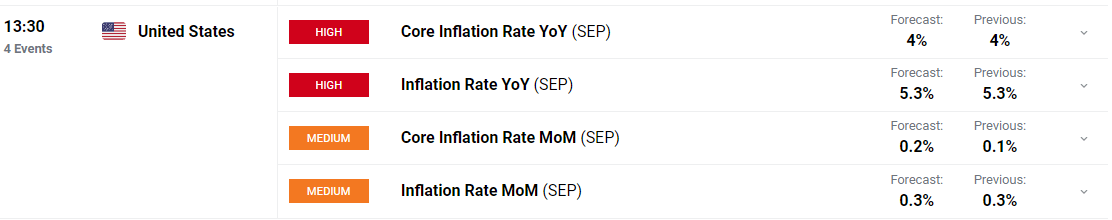
- US inflation data will define gold’s short-term price action.
- Retail traders trim net-short gold positions.
Trade Smarter - Sign up for the DailyFX Newsletter
Receive timely and compelling market commentary from the DailyFX team
Keep up to date with all market-moving data releases and events by using the DailyFX Calendar
The price of gold is currently pressing against a zone of resistance that has capped price action in the past few days. Gold has been aided by a shift lower in US bond yields with the 10-year UST now offered at 1.56%, compared to 1.63% seen on Monday. This move in yields has pushed the US dollar a fraction lower, although the DXY remains in a longer-term uptrend. Today’s US inflation release (13:30 BST) will be the next driver of price action and with current gold volatility low – using the 14-day ATR – it is unlikely that gold will be able to move significantly higher unless inflation numbers take a dip lower.
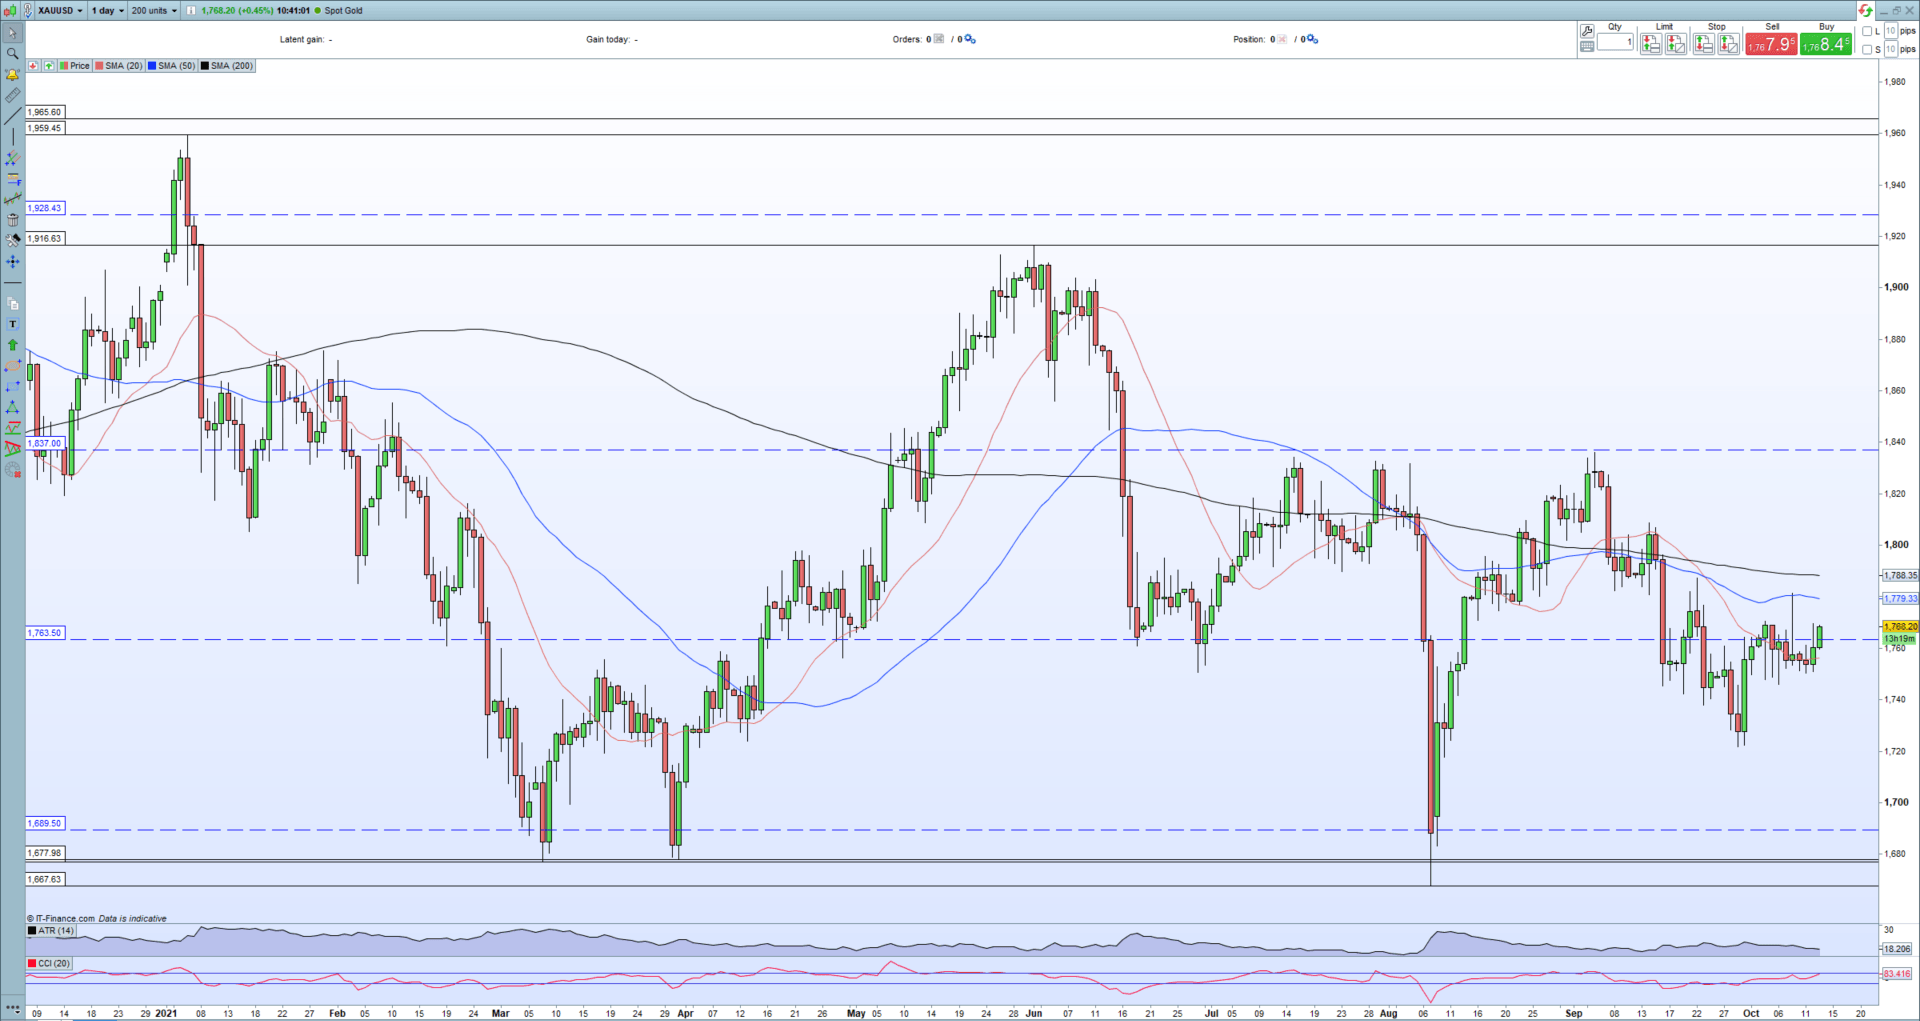
The daily gold chart shows the spot price back above the 50% Fibonacci retracement level at $1,763.5/oz, a level that gold has struggled to break and close above convincingly for the last three weeks. The precious metal has opened above the 20-day simple moving average, adding support for today’s move. There is now a cluster of old highs and the 50- and 200-day average blocking the way to, and past, $1,790/oz. The CCI reading is at its highest level in a month and is threatening to produce an overbought signal. Today’s US inflation release will guide gold’s short-term future.

Gold (XAU/USD) Daily Price October 13, 2021
Retail trader data show76.53% of traders are net-long with the ratio of traders long to short at 3.26 to 1. The number of traders net-long is 0.08% lower than yesterday and 1.39% lower from last week, while the number of traders net-short is 3.46% lower than yesterday and 17.46% lower from last week.
We typically take a contrarian view to crowd sentiment, and the fact traders are net-long suggests Gold prices may continue to fall.Traders are further net-long than yesterday and last week, and the combination of current sentiment and recent changes gives us a stronger Gold-bearish contrarian trading bias.

What is your view on Gold – bullish or bearish?? You can let us know via the form at the end of this piece or you can contact the author via Twitter @nickcawley1.


